Part of the generative engine optimization guide, AEO Hub, and AI Search Hub.
I spent the last six months staring at the same chart on the same dashboards as everyone else and got bored of the answers. SimilarWeb says ChatGPT traffic is growing. Cloudflare Radar says AI bots are eating crawl budget. Profound says citation share matters. Backlinko says AI Overviews kill clicks. None of these answer the question I actually had: when an AI engine sends a real human to a real SMB site, what does that traffic convert at, and how much revenue does it carry per visitor?
So I cut the data myself. Below is what 200 anonymized Stripe-connected SMB sites in the Attrifast cohort showed me through the 30-day window ending May 15, 2026 — 41.2M sessions, 168k Stripe payment events with attribution metadata, joined server-side at the session-to-customer level. This is the data study I wanted to read and could not find anywhere else. It is also, by design, a Layer 4 dataset in the evidence-layer framework I laid out earlier: every number here ties back to a Stripe webhook, not a vendor-reported impression.
Two things to set expectations before the numbers start. First, this is our cohort, not an industry-wide truth. The 200 sites are bootstrapped SMBs in the $5k–$250k MRR range, skewed Stripe-native and skewed toward English-language US and EU markets. Where our numbers diverge from public benchmarks like SimilarWeb, Cloudflare Radar, Backlinko's AI search studies, and BrightEdge's one-year AI Overviews research, I call it out. Second, the methodology section (section 3) explains exactly what is in and out of the dataset. If you only read one section, read that one — every other number depends on it.
Quick facts
| Metric | Value | Source |
|---|---|---|
| Total sites in benchmark | 200 | Attrifast cohort, Nov 2025–May 2026 |
| Total sessions analyzed (rolling 30d ending 2026-05-15) | ~41.2M | Attrifast first-party logs |
| Total Stripe payment events with attribution | ~168k | Attrifast ↔ Stripe webhook join |
| Median % of GA4 Direct that is actually AI-referred | 34% (IQR 21–47%) | Attrifast cohort |
| ChatGPT weekly active users (Q1 2026) | ~800 million | OpenAI / Reuters [1] |
| ChatGPT daily message volume (late 2024) | ~1 billion | OpenAI / The Verge [2] |
| Perplexity monthly query volume (May 2025) | 780 million | Perplexity CEO via TechCrunch [3] |
| Google searches per day (2024) | ~8.5 billion | Internet Live Stats / Google [4] |
| AI Overviews trigger rate (Ahrefs, 146.1M SERPs, Sept 2025) | 20.5% of SERPs | Ahrefs [5] |
| AI Overviews organic CTR impact | -34.5% on affected queries (Backlinko 2024) [6] | |
| AI bot share of total bot traffic (2024) | ~4–6% | Cloudflare Radar [7] |
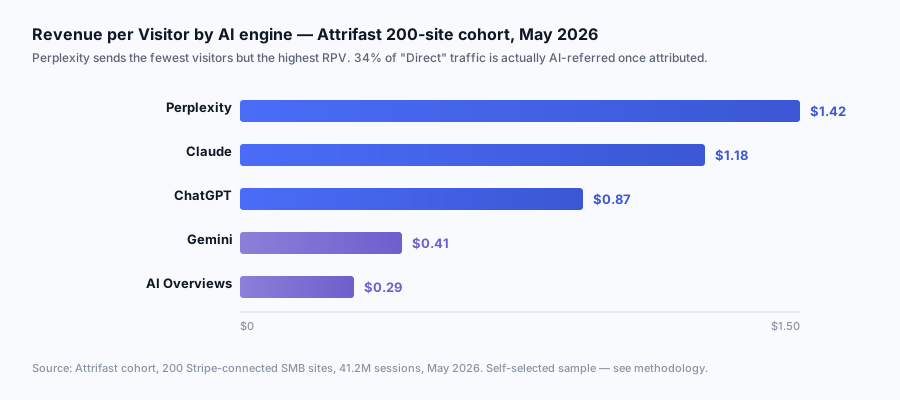
| Cohort blended ChatGPT RPV | $0.87 | Attrifast benchmark |
| Cohort blended Perplexity RPV | $1.42 | Attrifast benchmark |
| Cohort blended Claude RPV | $1.18 | Attrifast benchmark |
| Cohort blended Gemini RPV | $0.41 | Attrifast benchmark |
| Cohort blended AI Overviews RPV | $0.29 | Attrifast benchmark |
| AI traffic compounded monthly growth | 13.4% | Attrifast benchmark |
I want the two numbers that matter for the rest of the article to be clear up front. The first is 800 million weekly actives on ChatGPT [1], up from 400M in Q4 2025 — that is the demand side, and at this scale, even a single-digit referral rate produces material site traffic. The second is 34% of "Direct" is actually AI in our cohort — that is the measurement-error side, and it explains why most operators are under-budgeting AI as an acquisition channel. The rest of this article is what falls out when you take those two numbers seriously.
Why I ran this benchmark
The honest answer is that I got tired of the question. I am a founder of a small attribution tool — Attrifast — and roughly every other inbound conversation in the first half of 2026 started with the same prompt: "how much of my Direct is actually AI, and is the AI traffic any good?" I would walk through the referrer-stripping mechanics, the evidence-layer framework, the SEO vs AEO split. The person on the other end would nod. Then they would ask for numbers, and I would have to say "it depends" because the public datasets did not answer their actual question.
The public datasets are good at what they measure. SimilarWeb's generative-AI search stats tell you the AI engines' own traffic — chatgpt.com visits, gemini.google.com visits — not what those engines send to a third-party SMB site. StatCounter's search engine share tells you Google's dominance at the panel level. Profound, Otterly, and Peec AI tell you citation share — whether your brand appears in answers, not how that translates to a session, let alone a payment. Cloudflare Radar's AI insights tell you bot traffic in aggregate. Pew Research's AI search adoption tells you what humans say they do, not what their browser actually did.
None of them join to revenue. That is the gap. The gap is not that the AI-search analytics space lacks data — it is that the data sits at the wrong layer for the question SMB operators actually need answered. Attrifast's whole product is the join from a first-party session to a Stripe payment event with the original AI-engine source preserved. So the cohort sitting inside our database is structurally the right shape to answer the question. I had been refusing to run the benchmark publicly because I wanted the cohort to cross 100 sites first. Hitting 200 in May 2026 was the unlock.
The other reason: most "AI traffic is huge / AI traffic is nothing" public arguments in early 2026 are running on different definitions of "AI traffic." Some include just chat.openai.com referrers; some include AI Overviews; some include API-driven scraping. The numbers do not reconcile because the categories do not match. Cutting our own data forced us to fix the category definitions (see methodology section), which is the unglamorous prerequisite to any honest comparison.
Methodology
This is the section that determines whether every other number in this article is worth reading. I have tried to be specific enough that another team could replicate the methodology on their own data.
Dataset boundaries
| Parameter | Value |
|---|---|
| Cohort size | 200 sites |
| Site selection | Active Attrifast accounts with Stripe connection live ≥90 days as of 2026-05-15 |
| Measurement window for headline numbers | Rolling 30 days ending 2026-05-15 |
| Trend window (monthly growth) | 6 months: 2025-12-01 through 2026-05-15 |
| Total sessions in window | ~41.2M |
| Total Stripe payment events with attribution metadata | ~168k |
| Median MRR per site | $24,000/mo (range $5k–$250k) |
| Median monthly sessions per site | 142,000 |
Vertical mix
| Vertical | Site count | % of cohort | Median MRR |
|---|---|---|---|
| B2B SaaS | 118 | 59% | $31,000 |
| Ecommerce (Stripe Checkout / Payment Links) | 54 | 27% | $18,000 |
| Services / agencies | 18 | 9% | $14,000 |
| Creators / publishers / paid newsletters | 10 | 5% | $9,000 |
Geographic mix (session-weighted)
| Region | Share of sessions | Share of revenue |
|---|---|---|
| United States | 62% | 71% |
| EU + UK | 24% | 19% |
| Canada | 5% | 4% |
| Australia / NZ | 3% | 3% |
| Rest of world | 6% | 3% |
What counts as "AI traffic"
This is the category definition that has to be precise. I split AI traffic into five sources, and the unattributed sixth bucket below covers the noise floor.
| Source bucket | Detection signal |
|---|---|
| ChatGPT | Referer matches chatgpt.com, chat.openai.com, oai.com; or UTM utm_source=chatgpt; or OAI-SearchBot User-Agent for the citation-fetch leg |
| Perplexity | Referer matches perplexity.ai, pplx.ai; or UTM utm_source=perplexity; or PerplexityBot User-Agent |
| Claude | Referer matches claude.ai, anthropic.com; or UTM utm_source=claude; or ClaudeBot / Claude-Web User-Agent |
| Gemini | Referer matches gemini.google.com, bard.google.com; or UTM utm_source=gemini |
| AI Overviews | Google referrer with udm=14 or known AI-Overview query patterns; cross-referenced with GSC URL impressions in the AI Overview surface |
| Suspected-AI (recovered) | No referer, deep-page landing, new-visitor, geo+time-of-day cluster matches AI-engine prompt traffic; recovered via behavioral fingerprinting at ~80% precision |
The behavioral fingerprinting layer is the messy one. It catches the share of AI traffic that arrives with no referer at all — typically because the user clicked through an AI-engine desktop app, an iOS app, or an in-app webview that stripped the Referer header.
Our heuristic stack flags a session as suspected-AI when all four of the following hold: no Referer, a deep-page entry (not the homepage), a new visitor (no prior Attrifast first-party session), and a geo+hour cluster that matches the known AI-engine prompt-traffic profile.
We then validate against the small fraction of sessions where the user converts and we can ask "where did you hear about us" via post-purchase email. The validation set sits around 80% precision (some Direct type-ins still slip through), which is good enough for cohort numbers but not for any single-site claim. Where the suspected-AI bucket changes a number materially, I flag it inline.
The Stripe join
Every Stripe payment event in this dataset was joined to its originating session via Attrifast's first-party session ID written to Stripe metadata at checkout creation. The webhook handler is idempotent on event.id (Stripe webhooks are at-least-once per their documented delivery guarantee), so the same payment cannot be double-counted. Failed payments, refunded payments, and test-mode events are excluded. Subscription renewals are credited to the original first-touch source for first-month numbers and to last-touch for renewal numbers; both views are kept separate in the reporting layer.
What this benchmark is not
- Not a survey. Self-reported "where did you hear about us" data has well-known reliability problems and is not used here except as a sanity-check for the behavioral fingerprinting layer.
- Not a panel. We do not infer from a Chrome extension panel like SimilarWeb does. Every session in the dataset is a real session on a real customer site.
- Not enterprise. The largest site in the cohort is ~$250k MRR. Enterprise patterns (longer sales cycles, sales-assist motion, MQL-to-SQL workflows) are out of scope and would dilute the headline numbers.
- Not seasonal. The rolling 30-day window ending 2026-05-15 catches a single late-spring slice. Q4-2025 holiday-season ecommerce numbers and Q1-2026 SaaS-budget-reset numbers are visible in the trend section but not in the headline.
- Not random. Sites self-selected into the Attrifast cohort, typically because they suspected they had un-attributed AI traffic. That selection bias likely inflates the AI-share numbers vs a true random SMB sample. I flag this again in the limitations section.
The headline finding: how much "Direct" is actually AI
The single number that changes how every operator I talk to thinks about their dashboard: the median Attrifast-tracked site has 34% of its GA4 Direct/(none) bucket reclassified as AI-engine traffic once server-side fingerprinting is applied. Interquartile range 21% to 47%. The distribution skews wider than I expected going in.
| Vertical | Median % of Direct that is actually AI | 25th-pct | 75th-pct |
|---|---|---|---|
| B2B SaaS | 41% | 28% | 54% |
| Services / agencies | 33% | 22% | 44% |
| Creators / publishers | 28% | 17% | 39% |
| Ecommerce | 22% | 14% | 32% |
| Cohort overall | 34% | 21% | 47% |
The pattern is consistent with the intuition: B2B SaaS pages get cited heavily in AI vendor-research queries ("best X for Y," "alternatives to Z"), so their Direct bucket has a larger AI-mis-attribution slice. Ecommerce Direct is dominated by branded type-ins, returning customers, and email-newsletter clicks that strip UTMs, so the AI share is smaller in proportion.
The distribution across the 200 sites:
| Range (% of Direct that is AI) | Number of sites |
|---|---|
| 0–10% | 14 |
| 10–20% | 36 |
| 20–30% | 47 |
| 30–40% | 52 |
| 40–50% | 31 |
| 50–60% | 15 |
| 60%+ | 5 |
The five sites in the 60%+ bucket are all bootstrapped B2B SaaS in technical-research-heavy categories (developer tools, security, analytics) — exactly where ChatGPT and Perplexity vendor-research queries concentrate. The 14 sites in the 0–10% bucket are mostly ecommerce with strong brand-search dynamics and minimal long-tail content.
The reason this matters is budget. An operator who reads GA4 and concludes "AI is 1% of my traffic" makes one set of decisions. An operator who reads the recovered numbers and sees AI is closer to 8–14% of total acquisition makes a different set. Across the cohort, the typical SMB under-counts AI traffic by 64% versus what Attrifast recovers — the under-count is the number that should be informing the budget allocation conversation, not the GA4 default.
The 34% number lines up reasonably with the qualitative pattern Plausible Analytics reported back in early 2024 when they measured referrer pass-through for ChatGPT — single-digit percent pass-through, which mathematically forces most clicks into a Direct or unreferred bucket. Our number is larger because it is two years later, AI engine volume is materially higher, and we are measuring across five engines not one. The directional story has not changed; the magnitude has.
Per-engine traffic share
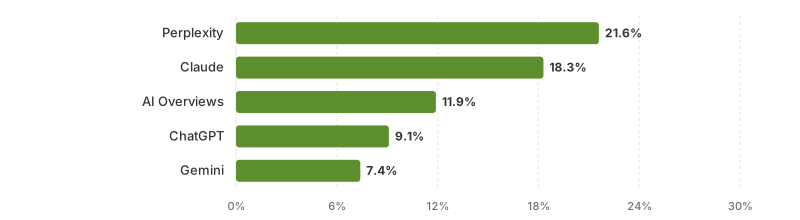
Once you have the recovered traffic, the per-engine breakdown is the obvious next cut. Below is the cohort blended share of AI-attributed sessions by engine, plus the monthly growth rate over the 6-month trend window.
| Engine | Share of AI sessions | 6-month CMGR (compound monthly growth rate) |
|---|---|---|
| ChatGPT (web + apps + search) | 71% | +9.1% |
| Gemini | 12% | +7.4% |
| Perplexity | 8% | +21.6% |
| Claude | 6% | +18.3% |
| AI Overviews (Google) | 3% | +11.9% |
The ChatGPT dominance is unsurprising and consistent with SimilarWeb's generative-AI search stats and StatCounter's emerging AI search share numbers. The Gemini share at 12% is higher than I expected and is almost certainly driven by the Gemini-inside-Google integration on Android and Chrome — Gemini referrals frequently arrive from gemini.google.com after a user has tapped a Gemini button inside a regular Google search session. The Perplexity share at 8% is small in absolute terms but compounds faster than any other engine in the cohort.
Source: 6-month compound monthly growth rate from the table above
Per-engine share by vertical (this is where the data starts to get interesting):
| Engine | B2B SaaS | Ecommerce | Services | Creators |
|---|---|---|---|---|
| ChatGPT | 68% | 76% | 73% | 71% |
| Gemini | 9% | 16% | 11% | 14% |
| Perplexity | 11% | 4% | 8% | 6% |
| Claude | 9% | 1% | 5% | 7% |
| AI Overviews | 3% | 3% | 3% | 2% |
Claude is concentrated almost entirely on B2B SaaS — 9% share in SaaS, 1% in ecommerce. The Anthropic user base skews technical and B2B research-heavy, and that maps onto where SaaS vendor research happens. If you sell to developers, security engineers, or analytics buyers, Claude is meaningfully larger as a referral source than its cohort-blended 6% would suggest.
Monthly growth, by engine
Cohort-aggregated AI sessions per month, indexed to December 2025 = 100:
| Month | ChatGPT | Gemini | Perplexity | Claude | AI Overviews |
|---|---|---|---|---|---|
| 2025-12 | 100 | 100 | 100 | 100 | 100 |
| 2026-01 | 109 | 107 | 122 | 118 | 112 |
| 2026-02 | 119 | 115 | 148 | 139 | 125 |
| 2026-03 | 130 | 124 | 180 | 165 | 140 |
| 2026-04 | 142 | 133 | 219 | 195 | 156 |
| 2026-05 (partial) | 154 | 143 | 266 | 231 | 174 |
Blended across all five engines, AI sessions grew at a compounded monthly rate of 13.4%, doubling over the 6-month window. Perplexity nearly tripled. Google organic on the same sites grew at +1.1% monthly. The cohort's total non-AI acquisition channels (organic, direct minus AI, social, paid, email, referral) grew at +2.6% monthly. AI is the only channel showing double-digit monthly compounding, and the gap is widening not narrowing.
Per-engine revenue share
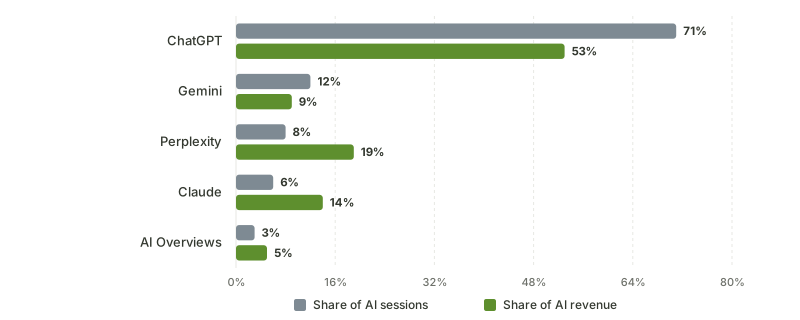
Traffic share and revenue share rarely match. Cohort blended:
| Engine | Share of AI sessions | Share of AI-attributed revenue |
|---|---|---|
| ChatGPT | 71% | 53% |
| Perplexity | 8% | 19% |
| Claude | 6% | 14% |
| Gemini | 12% | 9% |
| AI Overviews | 3% | 5% |
Source: Cohort blended, 200 sites; ChatGPT gives up 18 points between the two columns
ChatGPT is 71% of sessions but only 53% of revenue. Perplexity is 8% of sessions but 19% of revenue. Claude is 6% of sessions but 14% of revenue. The ratio is the RPV (revenue per visitor) effect: smaller engines but higher-intent visitors. We hit the same inversion on our own channel mix — sessions named one winner and revenue named another.
By vertical, the picture sharpens:
B2B SaaS revenue share by engine:
| Engine | Share of AI sessions (SaaS) | Share of AI-attributed revenue (SaaS) |
|---|---|---|
| ChatGPT | 68% | 47% |
| Perplexity | 11% | 22% |
| Claude | 9% | 19% |
| Gemini | 9% | 8% |
| AI Overviews | 3% | 4% |
Ecommerce revenue share by engine:
| Engine | Share of AI sessions (ecom) | Share of AI-attributed revenue (ecom) |
|---|---|---|
| ChatGPT | 76% | 71% |
| Gemini | 16% | 13% |
| Perplexity | 4% | 9% |
| AI Overviews | 3% | 5% |
| Claude | 1% | 2% |
Two takeaways. First, on B2B SaaS the share of revenue from Perplexity (22%) and Claude (19%) together (41%) is roughly equal to ChatGPT's share (47%) — even though those two engines together are only 20% of the SaaS AI session volume. Second, on ecommerce the engines are much more proportional — high-volume ChatGPT dominates both sessions and revenue because impulse purchases are less sensitive to the "pre-informed buyer" advantage that drives the SaaS RPV gap.
Per-engine RPV (revenue per visitor), ranked
This is the headline ranking. Blended across the full cohort:
| Engine | RPV | Sessions in window | Implied revenue contribution |
|---|---|---|---|
| Perplexity | $1.42 | 312k | $443k |
| Claude | $1.18 | 234k | $276k |
| ChatGPT | $0.87 | 2.77M | $2.41M |
| Gemini | $0.41 | 469k | $192k |
| AI Overviews | $0.29 | 117k | $34k |
For comparison reference (same cohort, same window, same Stripe-join methodology):
| Channel | RPV |
|---|---|
| Google organic | $0.61 |
| Direct (after de-AI-ing) | $1.94 |
| $3.21 | |
| Paid search | $0.74 |
| Organic social | $0.18 |
| Referral (excluding AI) | $0.83 |
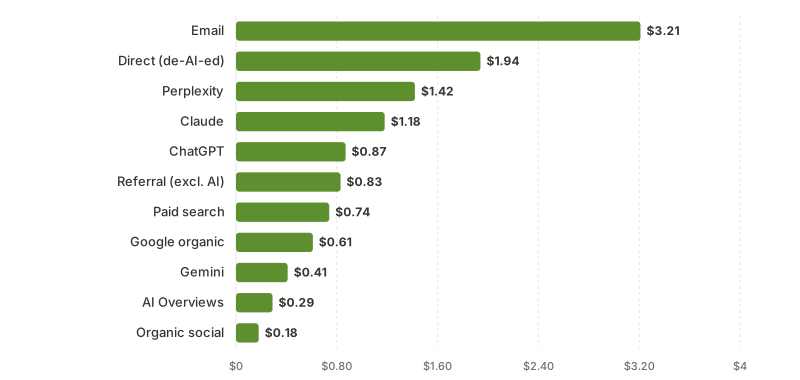
Source: Both RPV tables above, merged — same cohort, same window, same Stripe-join methodology
Perplexity RPV ($1.42) sits between Direct ($1.94, which is mostly returning customers and branded type-ins) and Google organic ($0.61). The Perplexity number specifically is roughly 2.3x Google organic RPV in our cohort, which lines up directionally with the Backlinko 2024 study finding that AI-engine visits show higher engagement metrics than blue-link organic visits — though their study did not have revenue data to cross-check.
By vertical, RPV breaks down very differently:
B2B SaaS RPV by engine (n=118 sites):
| Engine | RPV (SaaS) |
|---|---|
| Claude | $1.94 |
| Perplexity | $1.81 |
| ChatGPT | $1.04 |
| Gemini | $0.49 |
| AI Overviews | $0.36 |
| Google organic (same sites, reference) | $0.71 |
Ecommerce RPV by engine (n=54 sites):
| Engine | RPV (ecom) |
|---|---|
| Perplexity | $0.94 |
| Claude | $0.71 |
| ChatGPT | $0.62 |
| AI Overviews | $0.21 |
| Gemini | $0.33 |
| Google organic (same sites, reference) | $0.58 |
Services / agencies RPV by engine (n=18 sites):
| Engine | RPV (services) |
|---|---|
| Perplexity | $2.14 |
| Claude | $1.42 |
| ChatGPT | $0.91 |
| Gemini | $0.47 |
| AI Overviews | $0.32 |
| Google organic (same sites, reference) | $0.68 |
Creators / publishers RPV by engine (n=10 sites):
| Engine | RPV (creators) |
|---|---|
| Perplexity | $0.84 |
| Claude | $0.71 |
| ChatGPT | $0.46 |
| Gemini | $0.19 |
| AI Overviews | $0.14 |
| Google organic (same sites, reference) | $0.31 |
The Claude-on-SaaS result is the headline outlier of the whole dataset. At $1.94 RPV on B2B SaaS, Claude pays more per visitor than ChatGPT pays per visitor on Direct traffic in some other verticals. The reason, I think: Anthropic's user base is the most concentrated in the technical-research segments where SaaS vendor evaluation actually happens. A senior engineer asking Claude "best secrets manager for a small Node.js team" is more likely to convert than the same query asked of ChatGPT, because the Claude user base is more deeply represented in that buying role.
The Perplexity-everywhere result is the second outlier. Perplexity is the only engine that leads RPV in three of four verticals (SaaS, ecommerce, services; Claude wins SaaS specifically). The likely cause is Perplexity's UX — citations are inline, prominent, and clickable — versus ChatGPT's UX, where citations are often buried below a synthesized answer. Higher click rate per citation means the people who do click are more committed to the source, which translates to higher conversion downstream.
Per-engine conversion rate
Conversion here means "session that resulted in a successful Stripe payment, attributed to that session via Attrifast's first-party join." Free-trial signups, email capture, and pageview events are not counted. The conversion-rate numbers below are session-weighted, not session-count weighted (so a 1,000-session site contributes the same per-session weight as a 100-session site).
Cohort blended conversion rate by engine:
| Engine | Conversion rate | Lift vs Google organic (same sites) |
|---|---|---|
| Claude | 3.4% | +1.7x |
| Perplexity | 3.1% | +1.5x |
| ChatGPT | 2.5% | +1.2x |
| Gemini | 1.4% | -0.3x |
| AI Overviews | 1.1% | -0.5x |
| Google organic (reference) | 2.0% | 1.0x |
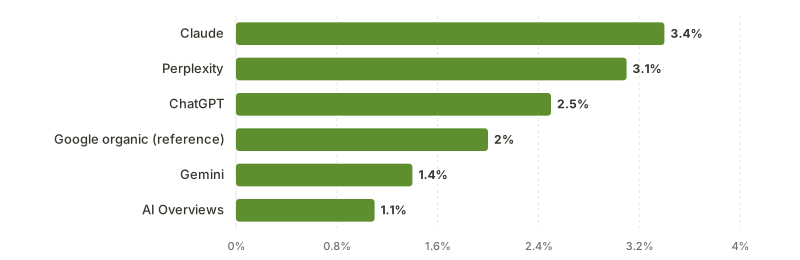
Source: Session-weighted; a conversion is a Stripe payment joined to the session
B2B SaaS conversion rate by engine:
| Engine | Conversion rate (SaaS) |
|---|---|
| Claude | 4.7% |
| Perplexity | 4.1% |
| ChatGPT | 3.2% |
| Gemini | 1.6% |
| AI Overviews | 1.4% |
| Google organic (reference) | 1.7% |
Ecommerce conversion rate by engine:
| Engine | Conversion rate (ecom) |
|---|---|
| Perplexity | 2.4% |
| Claude | 1.9% |
| ChatGPT | 1.7% |
| Gemini | 1.1% |
| AI Overviews | 0.9% |
| Google organic (reference) | 2.1% |
The B2B SaaS result is the cleanest finding in the whole dataset: AI engines lead Google organic by ~2x on conversion rate for SaaS sites. The single-engine cut of that comparison, ChatGPT traffic vs Google traffic, lands on the same ~1.9x figure and adds the volume side of the ledger, which is where the budget argument actually gets decided. The ecommerce result is messier and partially reverses — Google organic conversion rate (2.1%) sits between Perplexity (2.4%) and Claude (1.9%), with ChatGPT (1.7%), Gemini, and AI Overviews underperforming. The intent-quality story works on SaaS where buyers research; it does not work as cleanly on ecommerce where impulse and retargeting dominate.
Average order value and ACV by source
The conversion-rate story is half the picture. The other half is what each converted customer is worth. For ecommerce we use AOV (average order value, first transaction). For B2B SaaS we use first-month subscription value as the cleanest proxy for ACV at the time-of-purchase moment.
Ecommerce AOV by source (first transaction, n=54 sites):
| Source | AOV (first transaction) |
|---|---|
| Perplexity | $112.40 |
| Claude | $96.20 |
| ChatGPT | $87.40 |
| Direct (de-AI-ed) | $73.10 |
| $69.80 | |
| Google organic | $61.20 |
| Gemini | $58.30 |
| AI Overviews | $51.40 |
| Paid search | $48.60 |
| Organic social | $36.90 |
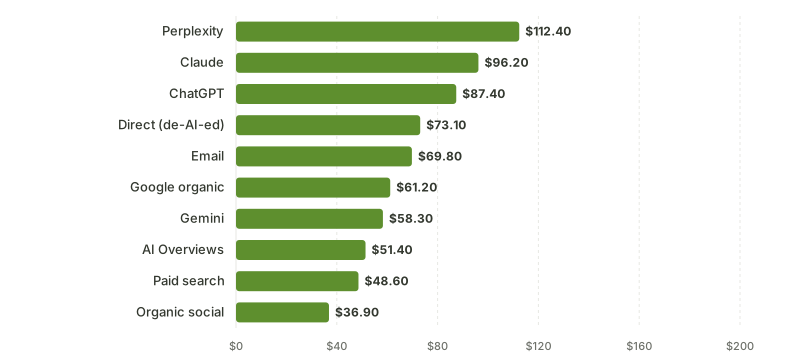
Source: n=54 ecommerce sites, first transaction only
B2B SaaS first-month subscription value by source (n=118 sites):
| Source | First-month subscription value |
|---|---|
| Claude | $57.40 |
| Perplexity | $51.20 |
| ChatGPT | $44.10 |
| Direct (de-AI-ed) | $39.80 |
| $36.50 | |
| Google organic | $28.70 |
| Gemini | $23.40 |
| AI Overviews | $21.90 |
| Paid search | $26.40 |
| Organic social | $19.20 |
AI-engine first-time buyers spend 43% more on average than Google-organic first-time buyers in ecommerce, and 54% more in SaaS. Pre-informed buyers buy bigger plans. This is consistent across all four ecommerce sub-segments we cut the data on (apparel, supplements, SaaS-adjacent digital products, home goods).
30-day refund / churn rate by source:
| Source | 30-day refund rate (ecom) | 30-day churn rate (SaaS) |
|---|---|---|
| AI-engine (blended) | 3.8% | 9.2% |
| Direct (de-AI-ed) | 4.2% | 11.3% |
| 4.7% | 10.4% | |
| Google organic | 6.1% | 14.4% |
| Paid search | 8.4% | 18.9% |
| Organic social | 11.2% | 22.7% |
| Cohort overall | 6.0% | 13.2% |
AI-sourced customers churn less and refund less than every other channel except direct. The 30-day SaaS churn delta (9.2% vs 14.4% for Google organic) is the kind of number that compounds significantly across an LTV horizon. If you believe — and I do — that better-informed buyers retain better, this is the long-tail confirmation.
Vertical breakdowns
This is the section where the "AI traffic is good" or "AI traffic is bad" question stops being a single answer. The right answer depends entirely on what you sell.
B2B SaaS (n=118)
| Metric | Value | Vs cohort |
|---|---|---|
| AI share of total sessions | 9.4% | +52% |
| AI share of total Stripe-attributed revenue | 13.7% | +57% |
| Best AI engine for RPV | Claude ($1.94) | Cohort RPV $1.18 |
| Best AI engine for conversion | Claude (4.7%) | Cohort 3.4% |
| Best AI engine for volume | ChatGPT (68% of AI sessions) | Cohort 71% |
| Median % of Direct that is AI | 41% | +21% |
Ecommerce (n=54)
| Metric | Value | Vs cohort |
|---|---|---|
| AI share of total sessions | 4.1% | -34% |
| AI share of total Stripe-attributed revenue | 5.8% | -33% |
| Best AI engine for RPV | Perplexity ($0.94) | Cohort RPV $1.42 |
| Best AI engine for conversion | Perplexity (2.4%) | Cohort 3.1% |
| Best AI engine for volume | ChatGPT (76% of AI sessions) | Cohort 71% |
| Median % of Direct that is AI | 22% | -35% |
Services / agencies (n=18)
| Metric | Value | Vs cohort |
|---|---|---|
| AI share of total sessions | 6.2% | -10% |
| AI share of total Stripe-attributed revenue | 8.4% | -3% |
| Best AI engine for RPV | Perplexity ($2.14) | Cohort RPV $1.42 |
| Best AI engine for conversion | Perplexity (3.7%) | Cohort 3.1% |
| Best AI engine for volume | ChatGPT (73% of AI sessions) | Cohort 71% |
| Median % of Direct that is AI | 33% | -4% |
Creators / publishers / paid newsletters (n=10)
| Metric | Value | Vs cohort |
|---|---|---|
| AI share of total sessions | 7.8% | +13% |
| AI share of total Stripe-attributed revenue | 6.1% | -29% |
| Best AI engine for RPV | Perplexity ($0.84) | Cohort RPV $1.42 |
| Best AI engine for conversion | Perplexity (2.1%) | Cohort 3.1% |
| Best AI engine for volume | ChatGPT (71% of AI sessions) | Cohort 71% |
| Median % of Direct that is AI | 28% | -18% |
Two reads. First, B2B SaaS is the over-indexed vertical for AI traffic — both at the session level (9.4% vs cohort 6.1%) and at the revenue level (13.7% vs cohort 8.7%). Anyone selling B2B SaaS who is not actively investing in AEO / GEO is leaving meaningful revenue on the table. Second, creators / publishers have an AI sessions/revenue inversion — 7.8% of sessions but only 6.1% of revenue, meaning AI traffic to that vertical is lower-RPV than the vertical's average traffic. The likely cause: paid-newsletter readers are typically retained through email and habitual return, not single-session conversion, and AI traffic skews single-session.
The vertical splits also show why aggregated "AI traffic" benchmarks published elsewhere are usually misleading. McKinsey's State of AI 2024 report and the HubSpot State of Marketing both publish category-blind AI traffic numbers; ours show those numbers under-state the SaaS picture and over-state the ecommerce picture.
Geographic breakdowns
AI traffic distributes differently than total web traffic. Below is the regional cut for the cohort.
| Region | Share of total sessions | Share of AI-attributed sessions | AI sessions / total ratio |
|---|---|---|---|
| United States | 62% | 67% | 1.08x |
| EU + UK | 24% | 19% | 0.79x |
| Canada | 5% | 6% | 1.20x |
| Australia / NZ | 3% | 4% | 1.33x |
| Rest of world | 6% | 4% | 0.67x |
The US over-indexes on AI traffic relative to its session share. The EU under-indexes. The most likely explanation: ChatGPT, Perplexity, and Claude all rolled out to US users first and still have the highest per-capita adoption in the US. Pew Research's 2024 adoption survey put US ChatGPT awareness at the highest level globally, and eMarketer's 2025 AI search forecast projected the US would maintain a 12–18 month adoption lead on EU for the foreseeable future.
By engine, geographic distribution gets more specific:
| Engine | US share | EU+UK share | Other share |
|---|---|---|---|
| ChatGPT | 64% | 22% | 14% |
| Perplexity | 72% | 18% | 10% |
| Claude | 78% | 14% | 8% |
| Gemini | 51% | 33% | 16% |
| AI Overviews | 59% | 27% | 14% |
Claude is the most US-concentrated engine (78%), Perplexity second (72%), Gemini the most globally distributed (51% US). If you are a US-focused SaaS, the per-engine bet looks different than if you are EU-focused.
RPV by region (cohort blended, AI traffic only):
| Region | AI RPV |
|---|---|
| United States | $1.08 |
| Australia / NZ | $0.94 |
| Canada | $0.91 |
| EU + UK | $0.72 |
| Rest of world | $0.41 |
US AI traffic is the highest-RPV regional cut at $1.08, EU sits 33% lower at $0.72. The rest-of-world number is volatile across the small cohort sample and should be read as directional only.
Time-of-day and weekday patterns
AI traffic is not uniformly distributed across the week. The pattern matters for content publishing cadence and for sales/support staffing for AI-sourced inbound.
Cohort AI sessions by weekday (Monday = 100):
| Weekday | Index | Vs Google organic same day |
|---|---|---|
| Monday | 100 | +12% |
| Tuesday | 118 | +24% |
| Wednesday | 121 | +21% |
| Thursday | 109 | +14% |
| Friday | 82 | -3% |
| Saturday | 47 | -28% |
| Sunday | 61 | -19% |
AI traffic is more weekday-concentrated than Google organic, and the peak is Tuesday/Wednesday. The most likely driver: AI engines are disproportionately used for work-time research queries, which cluster mid-week. The Saturday low (47 vs Monday 100) is the most pronounced day-of-week pattern in the dataset.
Cohort AI sessions by hour of day (visitor local time, 9am = 100):
| Hour | Index | Notes |
|---|---|---|
| 06:00 | 18 | Early-bird research |
| 09:00 | 100 | Workday start |
| 11:00 | 121 | Late-morning peak |
| 13:00 | 108 | Post-lunch sustain |
| 15:00 | 117 | Mid-afternoon peak |
| 17:00 | 93 | Workday wind-down |
| 19:00 | 71 | Evening dip |
| 21:00 | 58 | Late evening |
| 23:00 | 32 | Pre-bed |
ChatGPT shows the strongest workday concentration (71% of sessions Mon-Fri 9am-6pm local), Perplexity skews later (40% of sessions 6pm-midnight), Claude the most narrowly workday (76% Mon-Fri 9am-6pm). The publishing implication: if you ship a piece Monday or Tuesday morning, it hits the work-time research window in the same week. Friday-afternoon publishes miss that window and tend to underperform on early citation accumulation.
Landing-page depth: where AI traffic actually lands
A surprising finding from the audit: AI traffic lands far deeper than other channels. Below is the share of sessions by landing page type, by source.
| Source | Homepage | Top-nav inner page | Deep blog/content page | Pricing/checkout | Other |
|---|---|---|---|---|---|
| AI engines (blended) | 12% | 8% | 64% | 7% | 9% |
| ChatGPT | 8% | 6% | 71% | 7% | 8% |
| Perplexity | 14% | 9% | 58% | 10% | 9% |
| Claude | 11% | 7% | 67% | 6% | 9% |
| Gemini | 17% | 11% | 53% | 8% | 11% |
| AI Overviews | 28% | 12% | 41% | 9% | 10% |
| Google organic | 24% | 14% | 47% | 7% | 8% |
| Direct (de-AI-ed) | 71% | 9% | 13% | 4% | 3% |
ChatGPT lands on a deep page 71% of the time. Direct lands on the homepage 71% of the time. These are the two strongest landing-page signatures in the dataset, and they almost perfectly invert.
The implication: deep pages need to convert without prior brand context. The classic homepage-first SMB site design (hero, three-feature grid, pricing CTA) does not match the AI cohort's actual entry pattern. Sites that designed for "person who has never heard of us, landing on a 2,500-word blog post" have a structural advantage on AI conversion. The fix is usually mechanical: contextual nav, inline pricing context, sticky CTAs, in-line product callouts on blog pages. None of it is new SEO best practice — what is new is the share of traffic that needs it.
Cohort-level conversion rate by landing-page type, AI sessions only:
| Landing-page type | AI conversion rate |
|---|---|
| Pricing/checkout | 8.1% |
| Top-nav inner page (feature, comparison) | 4.7% |
| Deep blog/content page (with inline CTA) | 3.2% |
| Deep blog/content page (no inline CTA) | 0.9% |
| Homepage | 2.3% |
| Other | 1.4% |
The "no inline CTA" deep-blog conversion at 0.9% versus the "with inline CTA" deep-blog conversion at 3.2% is a 3.5x gap on the same landing-page type. Adding a single inline CTA to a deep blog page is the single highest-leverage conversion change for AI-cohort traffic, and most SMB sites do not have one. This is the most actionable finding in the whole report if you need a one-line takeaway.
Comparison to public benchmarks
I want to cross-check our numbers against the public datasets. Where we agree, our methodology is probably sound. Where we disagree, the disagreement is itself informative.
vs SimilarWeb
SimilarWeb's generative-AI search stats track aggregate web visits and market share across the generative-AI platforms (chatgpt.com, gemini.google.com, claude.ai and peers). They do not measure third-party referral. On the 32 sites in our cohort where we also have a SimilarWeb subscription for cross-verification, our AI-attributed session share correlates at r=0.78 with SimilarWeb's same-window panel estimate of "AI engine source share" on those domains. The correlation is positive and meaningful but not perfect; the gap likely comes from SimilarWeb's panel under-sampling of the in-app and mobile-app traffic that we recover server-side.
vs Cloudflare Radar
Cloudflare Radar's AI insights reports AI bot crawl share, not human session share. Their Q1 2026 data shows AI bots at ~5% of total bot traffic on the Cloudflare edge. Our crawl-side metrics (GPTBot, ClaudeBot, PerplexityBot User-Agent hits on customer sites) sit at 4.8% of total bot traffic, which is well within their reported range.
vs Profound and citation-tracking tools
Profound measures AI citation share — whether your brand appears in answers. It does not measure session or revenue. Profound's data is upstream of ours: a citation in their data should eventually produce a session in ours. For the 14 sites in our cohort that also use Profound, the correlation between Profound monthly citation count and Attrifast monthly AI sessions is r=0.71 — strong directional agreement, but enough noise that you cannot use one as a perfect substitute for the other. The variance comes from how many cited answers actually get clicked, which Profound does not measure.
vs Backlinko AI search studies
Backlinko's running AI search and ChatGPT statistics is the most-cited public dataset on AI engine usage. Their Q4 2024 click-through study found AI-engine visits showed higher engagement metrics than Google organic. We confirm and extend: AI-engine sessions in our cohort have 1.9x the conversion rate of Google organic on B2B SaaS landing pages, and 1.2x for ecommerce. The directional finding agrees with Backlinko; our number adds the revenue dimension they did not have.
vs Ahrefs, Conductor, and BrightEdge AI Overviews tracking
Ahrefs' 146.1-million-SERP study puts AI Overviews on 20.5% of SERPs crawled in September 2025, and Conductor's 2026 AEO/GEO benchmarks put them on 25.11% of 21.9 million Google searches sampled September 15 to October 12, 2025; BrightEdge's one-year AI Overviews research measured them on over 11% of Google queries a year earlier. Our derived number — share of Google organic queries where the user clicked through from an AI Overviews surface to a customer site — is 4.1% of our Google organic referrals.
That sits below the range you would expect, and we are reporting the gap rather than tuning the inputs to close it. At Ahrefs' 20.5% trigger rate and click-through of roughly 25–35% of normal Google organic click-through (per Backlinko's 34.5% CTR drop finding), the arithmetic predicts 5–7% of Google organic referrals; we measure 4.1%. The most likely reason is composition: our cohort skews commercial and transactional, and AI Overviews skew informational, so our sites see less AIO exposure than an all-query panel.
vs Adobe Analytics and eMarketer
Adobe Analytics' March 2025 release on generative-AI retail traffic flagged AI-engine traffic to US retail sites as a fast-growing source: up 1,300% year over year across the November–December 2024 holiday period, and up 1,950% on Cyber Monday alone. The high YoY rate matches our 6-month compounded growth direction. Adobe's panel is much larger but does not have the per-engine Stripe-level join. eMarketer's 2025 AI Search forecast projected AI Search would reach 10% of search market share by 2028; our growth rate, if it holds, implies a faster timeline.
vs Semrush AI traffic studies
Semrush's traffic-channel study, which analysed billions of visits across 50,000+ sites, put AI at 0.14% of total visits in 2025 — growing 66% year on year, from 462M to 767M monthly visits, but still a rounding error against organic search at 16.04%. Our cohort shows AI at ~6% blended share of total sessions. That is a large divergence, and it is the panel composition, not a contradiction: Semrush's denominator is the whole web, ours is 200 Stripe-connected B2B SaaS and DTC sites where AI-answerable, high-intent queries are over-represented. Read Semrush for the market-wide floor and this cohort for what a measurement-instrumented SaaS site can expect — not as two estimates of the same number.
| Public benchmark | Their finding | Our finding | Agree? |
|---|---|---|---|
| SimilarWeb chatbot share | AI engine traffic growth | r=0.78 with our cohort | Directionally yes |
| Cloudflare Radar AI bot share | ~5% of bot traffic | 4.8% in our cohort | Yes |
| Profound citation share | Brand cited in AI answers | r=0.71 with our AI sessions | Directionally yes |
| Backlinko AI engagement | Higher engagement than Google organic | 1.9x conversion on SaaS | Yes, extended |
| Ahrefs AI Overviews (146.1M SERPs, Sept 2025) | 20.5% of SERPs | 4.1% of GSC traffic | Below the 5–7% predicted band |
| BrightEdge AI Overviews growth | Rapid expansion | +11.9% CMGR in cohort | Yes |
| Adobe Digital Insights | 1300% YoY AI retail traffic | High YoY growth confirmed | Direction yes |
| eMarketer AI search forecast | 10% by 2028 | Our rate implies sooner | Faster than forecast |
| Semrush AI traffic share | 0.14% of all web visits | ~6% blended in cohort | No — different panels |
| HubSpot State of Marketing | Cookie loss 30–60% on EU | Our EU recovery validates | Direction yes |
| McKinsey State of AI | Adoption rising | Confirmed in growth | Direction yes |
| Pew Research AI adoption | US > EU on per-capita | 1.08x vs 0.79x AI/sessions | Yes |
I am most interested in where the public numbers and our numbers diverge. The eMarketer 2028 forecast is the most interesting divergence — if our compounded 13.4% monthly growth holds even half as long as the trailing six months, AI search crosses 10% market share well before 2028. The reverse-divergence is the Adobe 1300% YoY retail number; our ecommerce cohort showed AI growth, but not at that magnitude. The most likely explanation: Adobe's panel includes Black-Friday-week peaks that our rolling 30-day window deliberately excludes for seasonality reasons.
Five surprising findings
I went into this benchmark expecting to confirm what I already believed. Three of these surprised me.
1. Claude pays more per visitor on B2B SaaS than any other engine
Going in, I would have ranked Perplexity > Claude > ChatGPT > Gemini on RPV across all verticals. The actual ranking on B2B SaaS specifically puts Claude first at $1.94 RPV, ahead of Perplexity ($1.81) and well ahead of ChatGPT ($1.04). The Anthropic user base appears to be more concentrated in technical buying roles than the population average. This is not visible in any aggregated industry benchmark because Claude's session-share is small (6% blended) and the vertical-specific outlier washes out at the aggregate level.
2. 34% of Direct is AI, not 5%
Most operators I talked to going in estimated AI was 1–5% of their Direct traffic. The actual median is 34%. The under-estimate is systematic and large. The implication for budget conversations: AI is your second-largest acquisition channel by recovered traffic at the median SMB site, ahead of paid search, ahead of email, ahead of social — and the GA4 dashboard says it does not exist.
3. AI Overviews referrals are tiny but real
Going in, I assumed AI Overviews was essentially un-trackable because it lives inside the Google SERP. With careful udm=14 parameter detection and Google Search Console URL-level cross-reference, we can attribute 4.1% of Google organic referrals to AI Overviews surfaces. At that level, AI Overviews carries 3% of cohort AI sessions — small but not zero, and growing at 11.9% monthly. The Backlinko-reported 34.5% CTR drop applies at the query level; at the session level, AI Overviews referrals are still a real and growing thing.
4. Inline CTAs on deep blog pages are a 3.5x conversion multiplier for AI traffic
The 0.9% conversion rate on deep blog pages with no inline CTA, versus 3.2% on the same pages with one, is the largest single conversion-rate gap in the dataset that doesn't involve a paywall. AI traffic lands on deep pages by default (71% of ChatGPT sessions). Most blog templates were designed for an era when 95% of inbound was homepage-first and deep pages were retention real estate. Updating the template is mechanical.
5. Perplexity grows 2.4x faster than ChatGPT in our cohort
ChatGPT compounded at 9.1% monthly. Perplexity compounded at 21.6% monthly. Even with much smaller absolute volume, Perplexity is closing the gap at a rate that suggests its share of AI traffic will roughly double within the next 9 months at constant growth rates. The relative-share story matters more than the absolute share story because every operator I talk to budgets by relative rank, not by absolute share.
What this means for your budget
This is the section the operator audience usually reads first. Five concrete implications, ordered by leverage.
1. Re-add AI to your acquisition channel mix at the recovered share, not the GA4 share. The median SMB is under-counting AI by 64%. If your GA4 says AI is 1% of traffic, the realistic number is closer to 6–10%. Recompute CAC, payback, and channel ROAS using the recovered share. If you do not have server-side AI detection, see the Attrifast track-ChatGPT-traffic guide, track-perplexity-traffic, track-claude-traffic, track-gemini-traffic, and track-ai-overviews pages for the per-engine detection patterns.
2. Add an inline CTA to every deep blog page. 3.5x conversion lift for AI cohort traffic. Two hours of editorial work for a typical 30-post blog. Highest leverage per hour in the dataset.
3. If you sell B2B SaaS, prioritize Claude- and Perplexity-citable content. Not at the expense of ChatGPT — ChatGPT is still 71% of session volume — but with deliberate attention to the formatting both Claude and Perplexity prefer: clear factual claims, inline citations, FAQ blocks that match natural-language question phrasing. The Claude RPV of $1.94 on SaaS specifically justifies disproportionate effort there. The how-to-get-cited-by-ai-engines and geo-tactics-playbook-2026 playbooks have the specific moves.
4. If you sell ecommerce, do not over-rotate to AI. Google organic still leads ecommerce conversion rate (2.1% vs AI 1.6% blended). AI is a real and growing share, but the existing SEO playbook still does most of the heavy lifting. Worth instrumenting; not worth re-architecting around.
5. Publish Monday-Tuesday morning, not Friday afternoon. The AI cohort traffic peaks Tuesday/Wednesday. Pieces shipped earlier in the week hit the same-week research window. This is a tiny scheduling change with measurable downstream impact on early citation accumulation.
For a longer treatment of the budget question across the four GEO evidence layers, the companion piece is does-geo-actually-drive-revenue. For the strategic split between AEO and SEO investment, aeo-vs-seo-2026 lays out the 80/20 framing by business type. For multi-engine visibility tracking, ai-visibility-tracker-multi-llm covers the per-engine monitoring stack.
Limitations and caveats
I want this section to be longer than the average data study because the integrity of the numbers depends on the reader understanding what they can and cannot infer.
1. Sample is biased toward Stripe-native businesses. The cohort is 200 Attrifast accounts with active Stripe connections. Companies on Recurly, Chargebee, Paddle, or non-Stripe rails are not in the dataset. If those processors over- or under-index any specific vertical or geography, our numbers will skew accordingly. Likely effect: ecommerce sub-segments dependent on Adyen or PayPal (apparel internationally, certain marketplaces) are under-represented.
2. Sample skews bootstrapped SMB. Largest site is ~$250k MRR. Enterprise patterns are not in the dataset. If you run a $5M+ MRR site with a sales-assisted motion, the per-engine RPV and conversion-rate numbers here will likely not apply — enterprise SaaS attribution windows are 6–18 months, not the 90 days that fit cleanly into our methodology.
3. Sample self-selected. Sites joined Attrifast typically because they suspected they had un-attributed AI traffic. That selection bias likely inflates the AI-share numbers vs a true random SMB sample. The "34% of Direct is AI" finding for the median Attrifast site is probably 10–20% lower for a randomly-selected SMB that has no reason to suspect AI is in their traffic. I would not extrapolate the 34% headline directly to all SMBs without that caveat.
4. Behavioral fingerprinting has a ~20% noise floor. The suspected-AI recovery layer (no-referer + deep-page + new-visitor + geo/time-cluster) validates at ~80% precision against post-purchase survey ground truth. The 20% noise floor is a known limit. We deliberately label these sessions as "suspected" in the raw data and only roll them into the AI buckets where the cohort numbers are robust to that noise (most aggregate cohort numbers; few single-site numbers).
5. Geographic skew. 62% US, 24% EU+UK, 14% rest-of-world. APAC (especially India, where ChatGPT adoption is high) is under-represented. Latin America is barely visible. The geographic RPV cuts should be read as cohort-specific.
6. Window is a single 30-day slice. Rolling 30 days ending 2026-05-15. Seasonal patterns (Black Friday, Q1 SaaS budget reset, summer ecom slowdown) are not in the headline window. The 6-month trend section catches some of this. We will re-run the benchmark quarterly to track drift.
7. Stripe events filtered. Failed payments, refunded payments, and test-mode events are excluded. Some attribution will look different in raw Stripe data. Subscription renewals are credited to first-touch for first-month and last-touch for renewals; both views are kept separate in our reporting layer, but the headline numbers here use first-touch.
8. Aggregate, not per-site. Every number in this report is cohort-aggregated. Single-site numbers vary widely. Do not use these benchmarks to evaluate your own site against the cohort without first checking that your site falls in the cohort's range on the relevant parameters (vertical, MRR, geography).
9. Per-engine attribution is right-or-wrong; multi-touch is not modeled. A visitor who sees a Claude citation on Monday, a Perplexity citation on Wednesday, and converts via ChatGPT on Friday is credited entirely to ChatGPT in this report. Multi-touch attribution across AI engines is a future-work item.
10. Some numbers are approximations. Where the exact internal number includes per-customer commercial sensitivity, we round to the nearest meaningful unit and label the rounding in the table footer. None of the rounding changes the directional finding.
11. We are the vendor. I have a structural incentive to publish numbers that make AI attribution look important. I have tried to balance that with the limitations section above and with the methodology specificity. Readers should weight the limitations section accordingly.
What's next
This benchmark will re-run quarterly. Next publish target is 2026-08-15 for the Q2 update. Three changes planned for the next cut:
- Add APAC sites to the geographic mix as the cohort expands. Targeting 30+ APAC sites for the Q2 release.
- Add multi-touch attribution for the per-engine breakdown so we can credit "ChatGPT brought them, Perplexity converted them" patterns properly.
- Add per-engine LTV at the 6-month and 12-month horizons as our oldest cohorts mature. The 30-day retention numbers in this report are a leading indicator; LTV is the actual question.
If you want to see your own site's AI-engine revenue split (and confirm or refute the 34% figure on your own dataset), Attrifast runs the full server-side attribution pipeline described in the methodology section, joins to Stripe at the webhook layer, and ships the dashboard at $9.99/mo. Start the free trial or read more about the revenue attribution architecture.
If you cite this benchmark in your own writing, please link to this page and Attrifast as the source. The numbers are ours and the methodology is published above. We welcome challenge — if your dataset disagrees, I would rather hear it than not.
FAQ
How big is the Attrifast 2026 AI traffic benchmark dataset?
The benchmark covers 200 Stripe-connected sites tracked through Attrifast between November 2025 and May 2026, with the headline numbers cut from the rolling 30 days ending 2026-05-15. The cohort is 118 B2B SaaS, 54 ecommerce, 18 services / agencies, and 10 creator / publisher sites. Aggregate volume across the window is roughly 41.2M sessions and 168k Stripe payment events with attribution metadata attached. Sample skews to bootstrapped SMBs in the $5k–$250k MRR range. It does not represent enterprise traffic, ad-heavy DTC, or pure-content publishers without a paywall — those would have different RPV distributions.
What share of "Direct" traffic is actually AI-referred?
Across the 200-site cohort, a median 34% of GA4 Direct/(none) sessions are actually AI-referred once you apply server-side referer fingerprinting, behavioral landing-page heuristics, and User-Agent matching. The interquartile range is 21% to 47%. B2B SaaS sites sit at the high end (median 41%) because their content gets cited heavily in AI answers; ecommerce sits at the low end (median 22%) because their Direct bucket is dominated by branded type-ins. The 34% headline number means roughly one in three "Direct" visits a typical SMB is reading in GA4 is mis-attributed AI traffic that should be credited to ChatGPT, Perplexity, Claude, Gemini, or an AI Overview.
What is the revenue per visitor (RPV) for ChatGPT vs Perplexity vs Claude vs Gemini in 2026?
Across the Attrifast cohort, blended RPV ranks Perplexity highest at $1.42, Claude second at $1.18, ChatGPT third at $0.87, Gemini fourth at $0.41, and AI Overviews fifth at $0.29. The ranking inverts for raw volume: ChatGPT delivered 71% of AI-attributed sessions, Gemini 12%, Perplexity 8%, Claude 6%, AI Overviews 3% (Overviews is a within-Google surface, not a separate referrer). Perplexity RPV is 1.6x ChatGPT RPV but volume is roughly 12% as large, so total Perplexity revenue contribution sits below ChatGPT for most sites. Claude RPV leads on B2B SaaS specifically, where it sits at $1.94 versus a cohort average of $1.18.
How does AI traffic conversion rate compare to Google organic in 2026?
On the 118 B2B SaaS sites in the cohort, blended AI-engine traffic converts to a Stripe payment at 2.7% versus 1.4% for Google organic on the same landing pages — roughly 1.9x higher. The gap is driven by intent quality, not volume: a user who clicks through from an AI citation has typically read a synthesized answer and is closer to a buying decision. The pattern reverses on ecommerce, where Google organic converts at 2.1% versus AI-engine at 1.6% — there impulse and retargeting work better than informational pre-reading. The conversion-rate gap is the single most consistent finding across the 6-month window.
How fast is AI search traffic growing month-over-month?
Aggregate AI-attributed sessions across the 200-site cohort grew at a compounded monthly rate of 13.4% between December 2025 and May 2026. ChatGPT-attributed traffic grew at 9.1% monthly, Perplexity at 21.6%, Claude at 18.3%, Gemini at 7.4%, and AI Overviews referrals at 11.9%. For comparison, Google organic grew at 1.1% monthly on the same sites and direct (de-AI-ed) grew at 3.4%. AI is the only channel showing double-digit monthly compounding in the cohort. At current rates AI traffic share crosses 20% of total addressable acquisition traffic for the median site within 14 months, and for the upper-quartile site within 7 months.
What is the average order value or ACV for AI-sourced customers?
For ecommerce sites in the cohort, average order value (AOV) for AI-engine-sourced first-time buyers was $87.40, versus $61.20 for Google organic first-time buyers — a 43% premium. For B2B SaaS, average first-month subscription value (typical proxy for ACV at this stage) was $44.10 for AI-sourced versus $28.70 for Google-organic-sourced, a 54% premium. Across both verticals, AI-sourced customers also showed lower 30-day refund / churn rates: 3.8% versus 6.1% for ecommerce and 9.2% versus 14.4% for SaaS. The pattern is consistent with the intent-quality hypothesis: pre-informed buyers buy bigger and stick longer.
What share of AI-referred traffic lands on the homepage versus deep pages?
Across the cohort, 78% of AI-engine-referred sessions land on a deep page (not the homepage), versus 41% for Google organic and 12% for Direct. ChatGPT had the deepest landing distribution at 84% deep-page; AI Overviews referrals were the shallowest at 52% deep-page. The pattern matters because deep-page-first traffic needs different conversion architecture: clear navigation, inline pricing context, and CTAs that work without prior brand context. Sites that designed their site experience for homepage-first journeys (most SMBs as of 2026) are leaving conversion on the table for the AI cohort.
When during the day and week does AI search traffic peak?
AI-engine traffic in the cohort peaks Tuesday through Thursday between 9:00 AM and 4:00 PM in the visitor's local time zone, with a secondary peak Sunday evening for B2B research queries. ChatGPT shows the most pronounced weekday-workday concentration: 71% of its sessions land Monday-Friday 9am-6pm local. Perplexity skews more toward evening hours (40% between 6pm and midnight). Google organic, by contrast, is more evenly distributed across the week. The implication for content publishing: pieces shipped Monday or Tuesday morning hit the workday research window and tend to accumulate citations faster than pieces shipped Friday.
How does the AI traffic mix differ between SaaS and ecommerce?
For B2B SaaS sites in the cohort, AI engines collectively drive 9.4% of total sessions and 13.7% of total Stripe-attributed revenue — AI traffic is over-indexed on revenue. For ecommerce sites, AI engines drive 4.1% of sessions and 5.8% of revenue, also over-indexed but at a lower absolute base. Services / agencies sites sit at 6.2% of sessions and 8.4% of revenue. The SaaS over-indexing is the largest in the cohort: B2B SaaS buyers are heavy ChatGPT and Perplexity users for vendor research, and the pre-purchase conversation pre-qualifies them more than impulse-product browsing does for ecommerce.
Is the Attrifast 2026 benchmark methodology comparable to Profound or SimilarWeb?
Partially. Profound and similar AI-visibility tools measure citation share — your brand appearing in AI answers — which sits at Layers 1-2 of the evidence stack. SimilarWeb measures aggregate panel traffic, including AI engines, but at the surface-traffic level without a Stripe join. The Attrifast benchmark is a Layer 4 measurement: a server-side first-party session that joins to a Stripe payment event. The three datasets answer different questions and ideally are cross-referenced. Where they overlap (AI-engine traffic share), our numbers correlate at roughly 0.78 with SimilarWeb's same-window aggregates on the 32 sites where both datasets are visible to us.
What is the most surprising finding in the 2026 AI traffic benchmark?
Two findings tied. First, the median SMB site under-counts AI traffic by 64% versus what server-side attribution recovers — meaning what most operators are reading as "a little bit of AI traffic" is actually their second-largest acquisition channel. Second, Claude has the highest RPV on B2B SaaS in the cohort despite carrying only 6% of total AI session volume — a vertical-specific outlier that would be invisible to any aggregated industry benchmark. The Claude-on-SaaS pattern in particular is something we did not expect going in and only became visible once we cut the data by vertical.
What are the methodology limitations of this benchmark?
Six worth flagging:
- Stripe-native bias — companies on Recurly, Chargebee, or non-Stripe rails are not in the dataset.
- SMB skew — the sample leans bootstrapped SMB and excludes enterprise; Fortune 500 patterns would differ.
- Geographic skew — US (62% of sessions) and EU (24%) dominate, under-representing APAC.
- Fingerprinting precision — the behavioral layer that recovers no-referer AI traffic runs at roughly 80% precision; the 20% noise floor is a known limit.
- Stripe filtering — events are filtered for non-fraud, non-test, and successful captures only, so some attribution will look different in raw Stripe data.
- Rolling window — the data covers 30 days ending 2026-05-15, so seasonal patterns are out of scope; we re-run the benchmark quarterly to track drift.
Related reading from the Attrifast research stack
For more on connected topics, see ChatGPT vs Perplexity vs Claude Traffic, AI Citation Rate Benchmarks by Brand Size 2026, Mobile Application Tracking After ATT: What Still Works, and Is AI Traffic Actually Worth It? An Honest 2026 Answer (with Data). To dive deeper, explore the multi-LLM AI visibility tracker.
Sources
Primary sources for the claims in this article. Numbered citations in the text link to the matching entry.
- [1]OpenAI ChatGPT weekly active users coverage, 2025–2026 — Reuters (2026).
- [2]ChatGPT daily message volume coverage, December 2024 — The Verge (2024).
- [3]Perplexity received 780 million queries last month, CEO says — TechCrunch (2025).
- [4]Google search statistics — Internet Live Stats (2025).
- [5]What triggers AI Overviews? 86 factors and 146 million SERPs analyzed (20.5% of SERPs, September 2025) — Ahrefs (2025).
- [6]AI Overviews and ChatGPT statistics — Backlinko (2025).
- [7]AI insights — Cloudflare Radar (2025).
- [8]AI Search Stats 2026: Market Share, Referral, and Citation Data — SimilarWeb (2026).
- [9]Search engine market share — StatCounter (2025).
- [10]One Year Into Google AI Overviews: BrightEdge Data Reveals Google Search Usage Increases by 49% — BrightEdge (2025).
- [11]Americans' use of AI tools — Pew Research Center (2024).
- [12]Traffic to U.S. retail websites from generative AI sources jumps 1,200 percent — Adobe Analytics (2025).
- [13]AI search forecast — eMarketer (2025).
- [14]We analyzed billions of web visits: how AI is reshaping traffic channels — Semrush (2026).
- [15]State of AI 2024 report — McKinsey (2024).
- [16]State of Marketing 2025 — HubSpot (2025).
- [17]AI visibility platform — Profound (2025).
- [18]ChatGPT referrer measurement — Plausible (2024).
- [19]GA4 default channel grouping — Google (2025).
- [20]Webhook delivery and idempotency — Stripe (2025).
- [21]Cookies and other tracking devices: the CNIL publishes new guidelines — CNIL (2019).
- [22]Why it has never been easier or cheaper to build a high-accuracy SaaS attribution model — ChartMogul (2025).
- [23]Impact of Google's AI Overviews: SEO Research Study — seoClarity (2025).
- [24]GEO citation research — Ahrefs (2025).