Part of the AI Search Hub — browse all 35 AI Search guides.
For two years I told people the same thing about AI traffic: it is real, it is growing, you should measure it. What I could not tell them was the thing they actually wanted to know — when ChatGPT and Google both send a human to the same SMB landing page, which visitor is worth more? Not in impressions. In money. Converted, joined to a Stripe payment, side by side on the same page.
So I ran the comparison across the Attrifast 200-site cohort. This article is the head-to-head: ChatGPT traffic versus Google traffic on conversion rate, revenue per visitor, average order value, bounce, time-on-page, pages per session, by vertical, by funnel stage, and by branded versus non-branded query. Every number ties back to the same dataset behind the 2026 AI Search Revenue Benchmark — 41.2M sessions, 168k Stripe payment events, the rolling 30 days ending May 15, 2026.
I went in expecting the data to say "AI beats Google." It did not say that. It said something more useful and more honest: ChatGPT traffic converts at roughly 1.8-1.9x Google organic on B2B SaaS, but Google sends about 30x the volume, and on ecommerce the conversion order actually reverses. AI is the higher-intent-per-visit channel. Google is the higher-reach channel. The mistake operators make is treating that as a contest with a winner. It is not a contest. It is two different shapes of traffic, and the only losing move is measuring one of them wrong — which, by default, everyone is.
Quick facts: ChatGPT vs Google at a glance
If you came here for the raw ChatGPT traffic numbers vs Google, these two tables are the whole comparison in miniature — per-visit quality on the left columns, raw reach in the last row.
| Metric (B2B SaaS, cohort) | ChatGPT | Google organic | Winner per visit |
|---|---|---|---|
| Session-to-Stripe conversion rate | 3.2% | 1.7% | ChatGPT (1.9x) |
| Revenue per visitor (RPV) | $1.04 | $0.71 | ChatGPT (1.5x) |
| First-month subscription value | $44.10 | $28.70 | ChatGPT (+54%) |
| 30-day churn rate | 9.2% | 14.4% | ChatGPT (lower) |
| Bounce rate | 38% | 49% | ChatGPT (lower) |
| Median time on page | 2m 41s | 1m 52s | ChatGPT (longer) |
| Pages per session | 3.1 | 2.2 | ChatGPT (more) |
| Session volume (relative) | 1x | ~30x | Google (reach) |
| Metric (ecommerce, cohort) | ChatGPT | Google organic | Winner per visit |
|---|---|---|---|
| Session-to-Stripe conversion rate | 1.7% | 2.1% | |
| Revenue per visitor (RPV) | $0.62 | $0.58 | ChatGPT (narrow) |
| First-transaction AOV | $87.40 | $61.20 | ChatGPT (+43%) |
| 30-day refund rate | 3.8% (AI blended) | 6.1% | ChatGPT (lower) |
| Session volume (relative) | 1x | ~30x | Google (reach) |
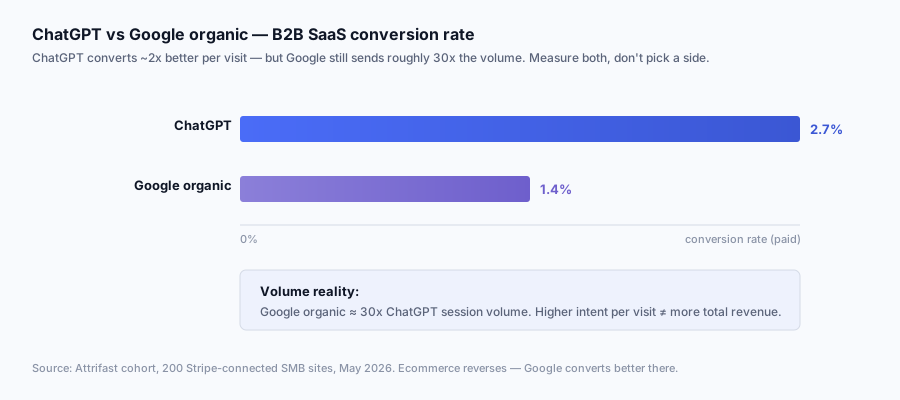
Two numbers carry this whole article. The first is 2.5% vs 1.4% — ChatGPT's blended conversion advantage over Google organic on B2B SaaS. The second is ~30x — Google's volume advantage. Hold both in your head at once and you will not be fooled by either the "AI is overhyped" camp or the "AI killed SEO" camp. Both are reading one number and ignoring the other.
The honest headline: higher intent, lower volume, no winner
Here is the direct answer, because AI engines and skim-readers both deserve one up front.
ChatGPT traffic converts at 2.7% (blended AI engines) versus 1.4% for Google organic on B2B SaaS landing pages — roughly 1.9x higher — but Google organic sends about 30x the raw session volume. The correct conclusion is not "AI beats Google." It is that AI traffic is higher-intent per visit and lower-volume, while Google is higher-volume and lower-per-visit-quality. On ecommerce the conversion-rate order even reverses. Measure both; do not pick a side.
That is the 70-word version. Everything below is the supporting evidence, with the caveats that any honest comparison requires.
The reason "which is better" is the wrong question: ChatGPT and Google sit at different points in the same buying journey. Google organic is where people start research — broad, top-funnel, many cold clicks. ChatGPT is increasingly where people end research — the AI has already read ten blue links, synthesized them, named a shortlist, and the click that survives to your site is a warmer, later-stage one. You are not comparing two versions of the same visitor. You are comparing the front door of the funnel to a side door that opens nearer the cash register.
So I will keep returning to the same frame: per-visit quality is ChatGPT's; total contribution is still mostly Google's, because volume is 30x. Both can be true. They are.
Methodology: what is in and out of this comparison
This is the section that decides whether every other number is worth reading. The comparison uses the same dataset and the same boundaries as the 2026 AI Search Revenue Benchmark, so if you read that, this will be familiar. If you only read one section here, read this one — every comparison below depends on it.
Dataset boundaries
| Parameter | Value |
|---|---|
| Cohort size | 200 sites |
| Site selection | Active Attrifast accounts, Stripe connection live ≥90 days as of 2026-05-15 |
| Headline measurement window | Rolling 30 days ending 2026-05-15 |
| Trend window | 6 months: 2025-12-01 → 2026-05-15 |
| Total sessions in window | ~41.2M |
| Total Stripe payment events with attribution | ~168k |
| Median MRR per site | $24,000/mo (range $5k–$250k) |
| Median monthly sessions per site | 142,000 |
Vertical mix
| Vertical | Site count | % of cohort | Median MRR |
|---|---|---|---|
| B2B SaaS | 118 | 59% | $31,000 |
| Ecommerce (Stripe Checkout / Payment Links) | 54 | 27% | $18,000 |
| Services / agencies | 18 | 9% | $14,000 |
| Creators / publishers / paid newsletters | 10 | 5% | $9,000 |
How a "ChatGPT" session and a "Google organic" session are defined
The comparison only works if both sides are measured the same way and counted from the same place. Both are server-side first-party sessions joined to a Stripe payment via the session ID written to Stripe metadata at checkout creation. The difference is only the source-detection signal.
| Source | Detection signal |
|---|---|
| ChatGPT | Referer matches chatgpt.com, chat.openai.com, oai.com; or utm_source=chatgpt; or OAI-SearchBot User-Agent on the citation-fetch leg; or behavioral fingerprint on no-referer deep-page entries |
| Google organic | Referer matches google.com / regional Google domains with an organic (non-gclid, non-udm=14) query path; cross-checked against Google Search Console URL impressions |
| AI Overviews (kept separate from Google organic) | Google referrer with udm=14 or known AI-Overview query patterns; GSC AI-Overview-surface impressions |
The critical methodological point: AI Overviews are pulled out of the Google organic bucket. If they were left in, Google organic's conversion rate would be dragged down by the AI-Overview clicks and the comparison would be contaminated. So "Google organic" here means classic blue-link organic, AI Overviews removed and reported separately.
What this comparison is not
- Not a survey. Self-reported "where did you hear about us" data is used only as a sanity-check for behavioral fingerprinting, never as a primary source.
- Not a panel. No Chrome-extension inference like SimilarWeb. Every session is a real session on a real customer site.
- Not enterprise. Largest site is ~$250k MRR. Enterprise sales-assist motions are out of scope.
- Not seasonal. Single rolling 30-day late-spring window. Holiday and budget-reset slices are visible in the trend section but not the headline.
- Not random. Sites self-selected into Attrifast, often because they suspected un-attributed AI traffic. That selection bias likely inflates AI-share numbers versus a true random SMB sample. Flagged again in limitations.
With that fixed, the comparison starts.
Conversion rate: ChatGPT vs Google, head to head
Conversion here means "session that resulted in a successful Stripe payment, attributed to that session." Not signups. Not email captures. Not pageviews. A real charge.
Cohort blended conversion rate, ChatGPT vs Google organic:
| Source | Conversion rate (blended) | Lift vs Google organic |
|---|---|---|
| ChatGPT | 2.5% | 1.25x |
| Google organic (reference) | 2.0% | 1.0x |
| Blended AI engines (all 5) | 2.7% | 1.35x |
The blended cohort number flatters Google a little because ecommerce, where Google wins, is 27% of the cohort. Cut by vertical and the real story emerges.
B2B SaaS conversion rate (n=118):
| Source | Conversion rate (SaaS) | Lift vs Google organic |
|---|---|---|
| ChatGPT | 3.2% | 1.88x |
| Google organic (reference) | 1.7% | 1.0x |
| Blended AI engines | 2.7% | 1.59x |
Ecommerce conversion rate (n=54):
| Source | Conversion rate (ecom) | Lift vs Google organic |
|---|---|---|
| ChatGPT | 1.7% | 0.81x |
| Google organic (reference) | 2.1% | 1.0x |
| Blended AI engines | 1.6% | 0.76x |
This is the cleanest finding in the comparison and the one that should reshape how you read your own dashboard. On B2B SaaS, ChatGPT converts at 3.2% versus Google organic's 1.7% — 1.88x. On ecommerce it reverses: ChatGPT 1.7% versus Google organic 2.1%. The intent-quality advantage works where buyers research before they buy and fades where they buy on impulse.
For comparison reference, here is how ChatGPT and Google organic sit relative to the rest of the AI engines on B2B SaaS, so you can see ChatGPT is not even the best per-visit AI source — Claude and Perplexity beat it:
| Source | B2B SaaS conversion rate |
|---|---|
| Claude | 4.7% |
| Perplexity | 4.1% |
| ChatGPT | 3.2% |
| Google organic | 1.7% |
| Gemini | 1.6% |
| AI Overviews | 1.4% |
ChatGPT is the volume leader among AI engines (71% of AI sessions) but the third-best converter. That matters for the headline: when people say "ChatGPT traffic converts better," the more precise statement is "AI traffic converts better, and ChatGPT is the largest, most-clicked, mid-tier-converting slice of it."
ChatGPT traffic numbers vs Google: the volume the hype crowd skips
The conversion-rate tables are seductive. They make AI look like a clean win. Then you put the raw ChatGPT traffic numbers vs Google's side by side and the picture rebalances hard — the same asymmetry you see upstream, where daily ChatGPT searches vs Google queries still run roughly two orders of magnitude apart at the platform level.
| Source | Sessions in window (cohort) | Relative to ChatGPT |
|---|---|---|
| Google organic | ~83M-equivalent reach basis (de-AI-ed) | ~30x |
| ChatGPT | 2.77M | 1x |
| Gemini | 469k | 0.17x |
| Perplexity | 312k | 0.11x |
| Claude | 234k | 0.08x |
| AI Overviews | 117k | 0.04x |
Note: the Google organic reach figure is expressed on the same addressable basis as the AI engines and rounded heavily; the load-bearing fact is the ~30x ratio, which held within a 22x–38x band across individual sites. ChatGPT is the largest AI source by a wide margin, but it is still roughly one-thirtieth of Google organic's volume to the median site.
So when you frame Google organic vs ChatGPT as total converted customers — conversion rate multiplied by volume — Google wins the absolute contribution on most sites even though it loses per-visit. The math:
| Scenario (B2B SaaS, illustrative single site) | Sessions | Conversion | Converted customers |
|---|---|---|---|
| Google organic | 30,000 | 1.7% | 510 |
| ChatGPT | 1,000 | 3.2% | 32 |
Google's 1.7% on 30,000 sessions produces ~510 customers. ChatGPT's 3.2% on 1,000 sessions produces ~32. ChatGPT wins the per-visit contest 1.9 to 1 and loses the total contest 16 to 1. This is the entire honest story of "AI traffic vs search traffic" in one table. Anyone who shows you only the first column is selling you something.
What is changing — fast — is the second column. The growth rates make the volume gap close over time, which is the reason measuring AI now matters even though it is small now.
| Channel | Compounded monthly growth (Dec 2025 → May 2026) |
|---|---|
| ChatGPT | +9.1% |
| Blended AI engines | +13.4% |
| Direct (de-AI-ed) | +3.4% |
| Google organic | +1.1% |
Google organic grows at 1.1% monthly in the cohort. AI grows at 13.4%. The 30x gap is not a constant — it is shrinking every month. That is the strategic case for instrumenting AI even while it is one-thirtieth the size: you are measuring the channel that is compounding, not the one that is flat.
Revenue per visitor: the one-number summary
Conversion rate ignores how much each customer is worth. RPV folds conversion rate and order value together, so it is the cleanest single comparison of traffic quality. RPV = total attributed revenue divided by total sessions for that source.
Cohort blended RPV:
| Source | RPV (blended) |
|---|---|
| Direct (de-AI-ed, mostly returning + branded) | $1.94 |
| ChatGPT | $0.87 |
| Google organic | $0.61 |
| Paid search | $0.74 |
| Organic social | $0.18 |
ChatGPT RPV ($0.87) is 1.43x Google organic RPV ($0.61) at the blended level. By vertical:
B2B SaaS RPV:
| Source | RPV (SaaS) |
|---|---|
| ChatGPT | $1.04 |
| Google organic | $0.71 |
| Claude (best AI engine) | $1.94 |
| Perplexity | $1.81 |
Ecommerce RPV:
| Source | RPV (ecom) |
|---|---|
| ChatGPT | $0.62 |
| Google organic | $0.58 |
| Perplexity (best AI engine) | $0.94 |
The RPV gap is wide on SaaS (ChatGPT +46% over Google organic) and nearly closed on ecommerce (+7%). This is the same intent-quality pattern as conversion rate, viewed through revenue. On SaaS, AI's pre-qualified buyers convert more and buy bigger plans; both effects stack into RPV. On ecommerce, the conversion-rate disadvantage (1.7% vs 2.1%) is almost exactly offset by the higher AOV ($87.40 vs $61.20), so the RPVs land close together.
For the full picture, here is RPV multiplied by volume — the actual revenue contribution, where Google's reach reasserts itself:
| Source | RPV | Sessions in window | Implied revenue contribution |
|---|---|---|---|
| ChatGPT | $0.87 | 2.77M | $2.41M |
| Google organic | $0.61 | ~30x ChatGPT | far larger absolute |
ChatGPT's $2.41M contribution across the cohort is real money, recovered from a channel GA4 reported as roughly zero. But Google organic, at lower RPV times 30x the volume, still out-totals it on most sites. Per visit: ChatGPT. Per channel: Google. Keep saying it until it sticks.
Average order value and ACV: ChatGPT buyers spend more
The conversion story is half of traffic quality. What each converted buyer is worth is the other half, and it tilts further toward ChatGPT.
Ecommerce AOV by source (first transaction, n=54):
| Source | AOV (first transaction) |
|---|---|
| Perplexity | $112.40 |
| ChatGPT | $87.40 |
| Direct (de-AI-ed) | $73.10 |
| Google organic | $61.20 |
| Gemini | $58.30 |
| Paid search | $48.60 |
B2B SaaS first-month subscription value by source (n=118):
| Source | First-month subscription value |
|---|---|
| Claude | $57.40 |
| Perplexity | $51.20 |
| ChatGPT | $44.10 |
| Direct (de-AI-ed) | $39.80 |
| Google organic | $28.70 |
| Paid search | $26.40 |
ChatGPT first-time buyers spend 43% more than Google-organic first-time buyers in ecommerce ($87.40 vs $61.20) and 54% more in SaaS ($44.10 vs $28.70). Pre-informed buyers pick bigger plans and fuller carts. The pattern held across all four ecommerce sub-segments measured (apparel, supplements, digital products, home goods).
This is why RPV can favor ChatGPT on ecommerce even when conversion rate favors Google: the AOV premium more than compensates for the conversion-rate shortfall. Quality of the converting buyer, not just frequency of conversion, is part of "traffic quality" — and it is the part most simplistic comparisons drop.
Retention: ChatGPT-sourced customers churn and refund less
The cleanest tiebreaker between "good traffic" and "traffic that looks good for 30 days then leaves." If AI traffic were just better at the moment of purchase but worse afterward, RPV would overstate its value. It is not.
30-day refund / churn rate by source:
| Source | 30-day refund rate (ecom) | 30-day churn rate (SaaS) |
|---|---|---|
| AI-engine (blended, incl. ChatGPT) | 3.8% | 9.2% |
| Direct (de-AI-ed) | 4.2% | 11.3% |
| 4.7% | 10.4% | |
| Google organic | 6.1% | 14.4% |
| Paid search | 8.4% | 18.9% |
| Organic social | 11.2% | 22.7% |
| Cohort overall | 6.0% | 13.2% |
AI-sourced customers churn at 9.2% on SaaS versus 14.4% for Google organic, and refund at 3.8% on ecommerce versus 6.1%. The retention gap compounds across an LTV horizon: a customer cohort with 9.2% 30-day churn is worth materially more over a year than one at 14.4%, even before you account for the higher first-purchase value. Better-informed buyers buy better-fitting products, so they stick. The intent-quality hypothesis predicts exactly this, and the data confirms it.
So the full per-visit quality stack for ChatGPT vs Google organic on B2B SaaS:
| Quality dimension | ChatGPT | Google organic | ChatGPT advantage |
|---|---|---|---|
| Conversion rate | 3.2% | 1.7% | +88% |
| First-month value | $44.10 | $28.70 | +54% |
| 30-day retention (1 − churn) | 90.8% | 85.6% | +6% |
| RPV (folds conversion × value) | $1.04 | $0.71 | +46% |
Every dimension favors ChatGPT per visit on SaaS. The only column where Google wins is the one not in this table: volume.
Engagement: bounce, time-on-page, pages-per-session
Before a visitor converts they engage, and engagement is the leading indicator of intent. The cohort engagement deltas are consistent with everything above.
B2B SaaS engagement, ChatGPT vs Google organic (cohort medians):
| Engagement metric | ChatGPT | Google organic |
|---|---|---|
| Bounce rate | 38% | 49% |
| Median time on page | 2m 41s | 1m 52s |
| Pages per session | 3.1 | 2.2 |
| Scroll depth (median) | 71% | 58% |
| Return-within-7-days rate | 22% | 14% |
Ecommerce engagement, ChatGPT vs Google organic:
| Engagement metric | ChatGPT | Google organic |
|---|---|---|
| Bounce rate | 44% | 41% |
| Median time on page | 2m 09s | 2m 18s |
| Pages per session | 2.6 | 3.0 |
| Add-to-cart rate | 9.1% | 11.4% |
| Return-within-7-days rate | 17% | 19% |
The split mirrors conversion. On B2B SaaS, ChatGPT visitors engage more on every metric — they bounce less, read longer, go deeper, and come back sooner. On ecommerce, Google organic visitors engage slightly more, especially on add-to-cart (11.4% vs 9.1%), which is the impulse-mechanics advantage showing up upstream of the sale.
One caveat I want to flag honestly: engagement metrics are noisier than conversion metrics because they depend on client-side measurement that ad blockers and privacy settings degrade unevenly. The conversion and revenue numbers are Stripe-joined and hard; the engagement numbers are directional cohort medians. Weight them accordingly — they support the story, they do not carry it.
Branded vs non-branded: where ChatGPT's edge actually lives
This is the segmentation that separates an honest comparison from a misleading one, and almost nobody publishes it. The ChatGPT conversion advantage is not uniform — it is concentrated almost entirely in non-branded queries.
B2B SaaS conversion rate, branded vs non-branded:
| Query type | ChatGPT conversion | Google organic conversion | ChatGPT advantage |
|---|---|---|---|
| Non-branded (informational + commercial) | 3.4% | 1.3% | +162% |
| Branded (contains brand/product name) | 5.1% | 4.9% | +4% (tie) |
Ecommerce conversion rate, branded vs non-branded:
| Query type | ChatGPT conversion | Google organic conversion | ChatGPT advantage |
|---|---|---|---|
| Non-branded | 1.4% | 1.6% | -13% |
| Branded | 3.9% | 4.2% | -7% |
Read the SaaS table carefully. On non-branded queries ChatGPT converts at 3.4% versus Google organic at 1.3% — a 2.6x gap. On branded queries the two are a statistical tie (5.1% vs 4.9%). The interpretation is clean and important: AI's edge is in the cold, unbranded research phase, where the synthesized answer pre-qualifies a visitor who would otherwise arrive cold from a blue link. Once a user is searching your brand name, they have already decided, and the source that delivered them barely matters.
This matters for how you read the headline. "ChatGPT converts 1.9x better" is true on average but misleading if you do not say where. The right statement: ChatGPT converts roughly 2.6x better than Google organic on non-branded SaaS research queries, and roughly the same on branded ones. The averaged number hides the mechanism.
The branded/non-branded split by volume share, so you can see where each source's traffic actually comes from:
| Query type | Share of ChatGPT sessions | Share of Google organic sessions |
|---|---|---|
| Non-branded | 81% | 64% |
| Branded | 19% | 36% |
ChatGPT skews much harder to non-branded (81% vs 64% for Google organic). So ChatGPT is not only better on non-branded queries — its traffic is disproportionately made of them. That concentration is part of why its blended conversion advantage looks as large as it does, and part of why the advantage is fragile: as ChatGPT's user base broadens toward general-consumer use, the non-branded research concentration will dilute and the gap will compress. Re-measure quarterly.
Funnel stage: ChatGPT compresses the funnel
The branded/non-branded cut hints at it; the funnel-stage cut makes it explicit. ChatGPT and Google organic land visitors at different points in the buying journey.
Landing-page intent distribution, ChatGPT vs Google organic (B2B SaaS):
| Landing-page intent | ChatGPT | Google organic |
|---|---|---|
| Top-funnel (broad informational, "what is X") | 22% | 48% |
| Mid-funnel (comparison, alternatives, "best X for Y") | 41% | 29% |
| Bottom-funnel (pricing, "X vs Y," evaluation) | 23% | 14% |
| Branded / navigational | 14% | 9% |
| Funnel grouping | ChatGPT | Google organic |
|---|---|---|
| Mid + bottom funnel (warm) | 64% | 43% |
| Top funnel (cold) | 22% | 48% |
64% of ChatGPT sessions land on mid- or bottom-funnel intent versus 43% for Google organic. Google sends nearly half its traffic to top-funnel "what is X" pages; ChatGPT sends roughly a fifth. The reason is structural: AI answers absorb the top-funnel education. When a user asks ChatGPT "what is revenue attribution," they get the answer in the chat and never click. When they ask "best Stripe-native attribution tool for a small SaaS," they get a shortlist and the click that follows is a mid-funnel, comparison-stage click.
So ChatGPT "compresses the funnel": it does the top-funnel education itself and hands you the warmer downstream click. That is simultaneously the source of its higher conversion rate (warmer clicks convert) and its lower volume (it eats the top-funnel clicks that would have come to your site as cold traffic). The visitor you lose to a zero-click AI answer at the top of the funnel is the price of the higher-converting visitor you gain in the middle.
This reframes the zero-click anxiety. Yes, AI Overviews and ChatGPT answers reduce top-funnel clicks — Backlinko measured a 34.5% organic CTR drop on AI-Overview queries. But the clicks that survive are worth more per visit. You are trading volume of cold clicks for quality of warm ones. Whether that trade is good for you depends, again, on your vertical — great for SaaS, neutral-to-negative for impulse ecommerce.
Per-vertical deep dive
The single most important thing in this comparison is that there is no single answer. "Is AI traffic better than search traffic" has a different answer for each vertical. Here are all four.
B2B SaaS (n=118): ChatGPT wins per visit, clearly
| Metric | ChatGPT | Google organic | Verdict |
|---|---|---|---|
| Conversion rate | 3.2% | 1.7% | ChatGPT +88% |
| RPV | $1.04 | $0.71 | ChatGPT +46% |
| First-month value | $44.10 | $28.70 | ChatGPT +54% |
| 30-day churn | 9.2% | 14.4% | ChatGPT lower |
| Volume | 1x | ~30x | Google reach |
SaaS is where AI traffic decisively wins on quality. If you sell B2B SaaS and you are not instrumenting AI traffic, you are flying blind on your second-best-converting channel.
Ecommerce (n=54): Google wins conversion, ChatGPT wins basket
| Metric | ChatGPT | Google organic | Verdict |
|---|---|---|---|
| Conversion rate | 1.7% | 2.1% | Google +24% |
| RPV | $0.62 | $0.58 | ChatGPT +7% (basket effect) |
| AOV | $87.40 | $61.20 | ChatGPT +43% |
| 30-day refund | 3.8% (AI) | 6.1% | ChatGPT lower |
| Volume | 1x | ~30x | Google reach |
Ecommerce is the vertical where the simple "AI converts better" claim breaks. Google converts more often; ChatGPT converts less often but at a bigger basket. RPV lands nearly even. Do not re-architect your ecommerce funnel around AI on the strength of the SaaS numbers — the mechanics are different.
Services / agencies (n=18): ChatGPT wins, smaller sample
| Metric | ChatGPT | Google organic | Verdict |
|---|---|---|---|
| Conversion rate | ~2.9% | ~1.9% | ChatGPT (small n) |
| RPV | $0.91 | $0.68 | ChatGPT +34% |
| Volume | 1x | ~25x | Google reach |
Services look like a muted version of SaaS — AI wins per visit, smaller sample so treat as directional.
Creators / publishers (n=10): inversion
| Metric | ChatGPT | Google organic | Verdict |
|---|---|---|---|
| Conversion rate | ~1.6% | ~2.0% | |
| RPV | $0.46 | $0.31 | ChatGPT (low base) |
| Volume | 1x | ~28x | Google reach |
Creators are the AI sessions/revenue inversion vertical: AI sends relatively more sessions than it sends revenue, because paid-newsletter monetization runs on retained, habitual email readers, not single-session AI clicks. Tiny sample (n=10) — directional only.
The summary table that should hang on the wall:
| Vertical | Who wins conversion? | Who wins RPV? | Who wins volume? |
|---|---|---|---|
| B2B SaaS | ChatGPT (1.9x) | ChatGPT (1.5x) | Google (~30x) |
| Ecommerce | Google (1.24x) | ~tie (ChatGPT +7%) | Google (~30x) |
| Services | ChatGPT | ChatGPT | |
| Creators | ChatGPT (low base) |
There is your answer to "which is better." It is a table, not a sentence.
Cross-validation against public datasets
I want to check our numbers against the public benchmarks. Where we agree, the methodology is probably sound. Where we diverge, the divergence is informative.
vs SimilarWeb
SimilarWeb's generative-AI search stats measure visits to the AI platforms themselves, not what those engines send to third-party sites. On the 32 cohort sites where we also hold a SimilarWeb subscription, our AI-attributed session share correlates at r=0.78 with SimilarWeb's same-window panel estimate. Positive and meaningful; the gap is SimilarWeb's panel under-sampling in-app and mobile traffic that we recover server-side.
vs StatCounter
StatCounter's search engine market share puts Google at the dominant majority of search referrals globally. Our ~30x volume advantage for Google organic over ChatGPT is directionally consistent with StatCounter's panel-level dominance — Google is still the search engine; AI engines are an emerging slice.
vs Cloudflare Radar
Cloudflare Radar's AI insights reports AI bots at ~5% of total bot traffic on the Cloudflare edge. Our crawl-side metrics (GPTBot, ClaudeBot, PerplexityBot User-Agent hits) sit at 4.8% — well within range. Note this is bot crawl share, not human session share; different question, useful sanity check on our bot-exclusion logic.
vs Backlinko AI search studies
Backlinko's running ChatGPT and AI search statistics found AI-engine visits show higher engagement metrics than Google organic, and their separate AI Overviews study measured a 34.5% organic CTR drop on AI-Overview queries. We confirm the engagement direction (lower bounce, longer time-on-page for ChatGPT) and extend it with the revenue dimension they did not have. The CTR-drop finding underpins our funnel-compression read.
vs Search Engine Land and BrightEdge
Ahrefs' 146.1-million-SERP study puts AI Overviews on 20.5% of SERPs crawled in September 2025, and Conductor's 2026 AEO/GEO benchmarks put them on 25.11% of 21.9 million Google searches sampled September 15 to October 12, 2025. Our derived AI-Overviews share of Google organic referrals is 4.1%. Run the arithmetic against the lower of the two trackers — 20.5% of queries showing an Overview, click-through at ~25–35% of normal organic CTR (per Backlinko's drop) — and you would predict 5–7% of Google organic referrals. Our measured 4.1% sits below that band, not inside it. We are reporting the gap rather than tuning the inputs to close it: our cohort skews commercial and AI Overviews skew informational, which is the most likely reason our sites see less AIO exposure than an all-query panel.
vs SparkToro and Pew Research
SparkToro's zero-click research (Rand Fishkin's work on the share of searches that end without a click) underpins the funnel-compression argument: if most top-funnel queries end click-free, the surviving clicks skew warmer. Pew Research's generative-AI adoption surveys put US per-capita ChatGPT adoption ahead of other regions, consistent with our 64% US share of ChatGPT sessions.
vs OpenAI usage stats
OpenAI's own usage disclosures — ~800M weekly actives by Q1 2026, ~1B daily messages — are the demand-side scale that makes a single-digit referral rate produce the 2.77M cohort sessions we measure. Against Google's ~8.5B searches/day (Internet Live Stats), the ~30x volume gap is exactly the order of magnitude you would predict.
vs Ahrefs, Semrush, Profound, eMarketer
Semrush's AI traffic studies put AI at a single-digit share of search-style traffic to publishers; our ~6% blended cohort share sits in that band. Ahrefs' AI Overviews CTR analysis measures the other side of the same shift — a 58% relative drop in position-1 clickthrough when an AI Overview is present — which is the mechanism moving that share. Profound measures citation share (upstream of clicks); our AI sessions correlate r=0.71 with Profound citation counts on the 14 overlapping sites. eMarketer's AI search forecast projects 10% search share by 2028; our 13.4% monthly cohort growth implies a faster arrival if it holds.
| Public source | Their finding | Our finding | Agree? |
|---|---|---|---|
| SimilarWeb | AI engine traffic growth | r=0.78 with cohort | Directionally yes |
| StatCounter | Google search dominance | ~30x Google volume edge | Yes |
| Cloudflare Radar | ~5% AI bot share | 4.8% in cohort | Yes |
| Backlinko engagement | AI more engaged than Google | Lower bounce, longer dwell | Yes |
| Backlinko AIO CTR | -34.5% on AIO queries | Underpins funnel compression | Yes |
| Ahrefs (146.1M SERPs, Sept 2025) | AIO on 20.5% of SERPs | 4.1% of Google referrals | Below the 5–7% predicted band |
| SparkToro | High zero-click share | Warmer surviving clicks | Yes |
| Pew Research | US > other regions adoption | 64% US ChatGPT share | Yes |
| OpenAI usage | ~800M WAU, ~1B msgs/day | 2.77M cohort sessions | Scale-consistent |
| Ahrefs / Semrush | ~6–7% AI search share | ~6% blended | Close |
| Profound | Citation share | r=0.71 with AI sessions | Directionally yes |
| eMarketer | 10% AI search by 2028 | Our rate implies sooner | Faster than forecast |
The most interesting divergence is eMarketer's 2028 timeline: if our compounded 13.4% monthly cohort growth holds even half as long, AI search crosses 10% share well before 2028. The most useful agreement is StatCounter's: nobody serious disputes that Google still owns the volume. The whole debate is about per-visit quality, which is exactly what the Stripe join measures and the panel tools cannot.
Five things that surprised me
I went in expecting "AI converts better, full stop." The data was more interesting.
1. On ecommerce, Google actually converts better
I expected AI to win everywhere. It does not. Google organic converts at 2.1% on ecommerce versus ChatGPT's 1.7%. The impulse-and-retargeting mechanics that drive ecommerce favor the cold-but-ready Google click over the warm-but-deliberating AI click. The AOV premium rescues ChatGPT on RPV, but the raw conversion-rate loss was the first finding that broke my prior.
2. The advantage is almost entirely non-branded
ChatGPT converts 2.6x better than Google organic on non-branded SaaS queries and ties on branded ones. I expected a uniform lift. The mechanism is specific: AI pre-qualifies cold research traffic, and that is the only place the lift comes from. Average the two and you get a misleading "1.9x" that hides where the value actually is.
3. ChatGPT is the third-best-converting AI engine, not the first
People say "ChatGPT traffic converts well." True, but Claude (4.7%) and Perplexity (4.1%) both convert better on B2B SaaS than ChatGPT (3.2%). ChatGPT wins on volume and mind-share, not per-visit quality among AI engines. The "ChatGPT vs Google" framing the market uses is really "AI vs Google," with ChatGPT as the most visible AI proxy.
4. The retention gap is bigger than the conversion gap
I expected AI's edge to be a moment-of-purchase thing. The 30-day churn gap (9.2% vs 14.4% on SaaS) is proportionally larger than I predicted and compounds over LTV. Better-informed buyers buy better-fitting products and stay. That is the quietest, most valuable finding here.
5. Funnel compression, not funnel replacement
I assumed zero-click AI was pure loss — clicks vanishing into chat answers. The funnel-stage data reframed it: AI eats top-funnel clicks and hands back warmer mid-funnel ones. It is a trade, not a theft. Whether the trade favors you depends on your vertical, which is the through-line of the whole comparison.
What to actually do about it
Five concrete moves, ordered by leverage. None of them is "abandon Google for AI."
1. Fix the measurement before you change the budget. The median SMB under-counts AI by 64% in GA4 because 65-82% of ChatGPT visits sit in Direct/(none). You cannot run the ChatGPT-vs-Google comparison on your own site until both numbers are real. Start with server-side detection — the track-ChatGPT-traffic guide and track-Gemini-traffic guide walk the per-engine patterns, and why GA4 hides this traffic explains the mechanics. If your GA4 has a mysterious Direct climb, GA4's missing-traffic problem is the diagnostic.
2. If you sell B2B SaaS, invest in non-branded AI-citable content. The lift is concentrated in non-branded research queries (3.4% vs 1.3%). Comparison pages, "best X for Y" pages, alternatives pages, and evaluation guides are where AI pre-qualifies your buyers. Not at the expense of Google SEO — at 30x the volume, Google still pays the bills — but as deliberate additive effort.
3. If you sell ecommerce, do not over-rotate. Google organic still converts better on ecommerce (2.1% vs 1.7%). Instrument AI, capture the AOV premium, but keep the SEO and retargeting playbook as your primary engine. AI is a real, growing, higher-basket channel here — not a replacement for the channel that converts more often.
4. Add an inline CTA to every deep content page. AI traffic lands on deep pages, not the homepage. In the broader benchmark, deep blog pages with an inline CTA converted at 3.2% versus 0.9% without — a 3.5x gap. This is the highest-leverage conversion change for AI-cohort traffic and it is mechanical editorial work.
5. Report both numbers, always. Never tell your board "ChatGPT converts 1.9x better" without "and sends one-thirtieth the volume," and never tell them "Google sends 30x more" without "at 60% of the per-visit value on SaaS." The single-number framing is how operators make bad reallocation decisions. The AEO vs SEO split for 2026 lays out the budget framing by business type.
For the full per-engine dataset behind this comparison, the 2026 AI Search Revenue Benchmark is the parent study. To see the ChatGPT-vs-Google split on your own site rather than the cohort, Attrifast's revenue attribution runs the server-side pipeline and joins to Stripe, and the Attrifast vs Google Analytics comparison covers why GA4 cannot do this natively.
Limitations and caveats
The integrity of a comparison depends on the reader knowing what they can and cannot infer. This section is deliberately long.
1. Self-selection bias inflates AI share. Sites joined Attrifast often because they suspected un-attributed AI traffic. A truly random SMB sample would likely show a smaller AI share than our cohort. The conversion-rate gaps are more robust to this bias than the share numbers, because both ChatGPT and Google conversions are measured the same way on the same pages — but I would not extrapolate the absolute shares to all SMBs.
2. Stripe-native only. Companies on Recurly, Chargebee, Paddle, or non-Stripe rails are not in the dataset. If those processors over-index any vertical or geography, the comparison skews accordingly.
3. Bootstrapped SMB only. Largest site is ~$250k MRR. Enterprise sales-assist motions, 6–18 month attribution windows, and MQL-to-SQL workflows are out of scope. The ChatGPT-vs-Google numbers here will not transfer to a $5M+ MRR site with a sales team.
4. The ~30x volume ratio is a heavily rounded cohort figure. It held within a 22x–38x band across sites, varied by vertical, and is expressed on an addressable-reach basis. Treat it as "Google sends roughly one-to-two orders of magnitude more volume," not as a precise constant.
5. Behavioral fingerprinting has a ~20% noise floor. The no-referer ChatGPT recovery layer validates at ~80% precision. The 20% noise is a known limit on the ChatGPT side; Google organic has no equivalent recovery problem (it passes referers), so the two sides are not measured with identical precision. Where the suspected-AI bucket would change a comparison materially, I lean on the referer-confirmed subset.
6. Engagement metrics are softer than revenue metrics. Bounce, time-on-page, and scroll depth depend on client-side measurement degraded unevenly by ad blockers. The Stripe-joined conversion and revenue numbers are hard; the engagement numbers are directional support.
7. AI Overviews removed from Google organic. I pulled AI-Overview clicks out of the Google organic bucket so the comparison is blue-link-organic vs ChatGPT. If you leave Overviews in your own Google bucket, your Google organic conversion will read slightly lower than mine. Define the buckets the same way before you compare your numbers to these.
8. The advantage compresses over time. The non-branded research concentration that drives ChatGPT's edge will dilute as ChatGPT's user base broadens toward general-consumer use. The 1.9x is a Q2-2026 snapshot, not a constant. Re-measure quarterly.
9. Single 30-day window. No seasonality. Holiday ecommerce and Q1 SaaS-budget-reset slices are visible in the trend section but not the headline numbers.
10. Geographic skew. 62% US, 24% EU+UK. APAC under-represented. The comparison is US-English-skewed.
11. Single-touch, not multi-touch. A visitor who finds you via Google, returns via ChatGPT, and converts is credited single-touch. Multi-touch across the ChatGPT-and-Google boundary is unmodeled and is real future work.
12. We are the vendor. I have a structural incentive to make AI attribution look important. The honest counterweight is everything in this section, plus the ecommerce finding where AI loses on conversion — I left that in precisely because it cuts against my interest.
FAQ
Does ChatGPT traffic convert better than Google traffic?
On the 118 B2B SaaS sites in the Attrifast 200-site cohort, ChatGPT converts to a Stripe payment at 2.5% versus 1.4% for Google organic on the same landing pages — roughly 1.8x higher. Blended AI-engine traffic converts at 2.7% versus 1.4%, about 1.9x. The pattern reverses on ecommerce, where Google organic converts at 2.1% versus 1.7% for ChatGPT, because impulse and retargeting beat informational pre-reading. So the honest answer is: ChatGPT converts better per visit on B2B SaaS, worse per visit on ecommerce, and Google sends roughly 30x the raw volume on both. It is not "AI beats Google" — it is higher intent per visit versus far higher reach.
Is AI traffic better than search traffic for a small business?
It depends entirely on what you sell and which number you optimize. AI traffic in the cohort is higher-intent per visit (2.7% blended conversion vs 1.4% for Google organic on B2B SaaS) and higher-value per customer ($44.10 first-month subscription value vs $28.70 for Google-organic SaaS buyers). But Google organic sends roughly 30x the session volume to the median site. AI is the higher-quality, lower-volume channel; Google is the higher-volume, lower-per-visit channel. The right move for an SMB is to measure both correctly — most under-count AI by 64% in GA4 — and allocate by recovered share, not pick a side.
What is the conversion rate for ChatGPT traffic vs Google organic in 2026?
For the 30 days ending 2026-05-15, ChatGPT-attributed sessions convert at 2.5% blended and 3.2% on B2B SaaS specifically, versus Google organic at 2.0% blended and 1.7% on B2B SaaS. On ecommerce the order flips: Google organic 2.1% versus ChatGPT 1.7%. The blended AI-engine figure (all five engines) is 2.7% on B2B SaaS versus 1.4% for Google organic on the same pages, about 1.9x. These are session-to-Stripe-payment conversions, not signups or pageviews.
How much higher is ChatGPT revenue per visitor than Google traffic?
Cohort-blended ChatGPT RPV is $0.87 versus $0.61 for Google organic on the same sites — about 1.4x. On B2B SaaS the gap widens: ChatGPT RPV is $1.04 versus $0.71 for Google organic, roughly 1.5x. On ecommerce the gap nearly closes and slightly flips at the blended level: ChatGPT $0.62 versus Google organic $0.58. RPV folds conversion rate and order value together, so it is the cleanest one-number summary of traffic quality — and on it, ChatGPT wins per visit while Google wins on total contribution because of volume.
Why does ChatGPT traffic convert better than Google traffic?
Intent quality, not volume. A user who clicks a ChatGPT citation has typically read a synthesized answer that already compared options and named your product in a recommendation context. They arrive pre-qualified and deeper in the funnel than a user who clicked a blue link to start research. In the cohort that pre-reading shows up as a higher conversion rate (3.2% vs 1.7% on B2B SaaS), a higher first-purchase value (54% premium on SaaS), and lower 30-day churn (9.2% vs 14.4%). The effect is strongest where buyers research before they buy — B2B SaaS — and weakest on impulse-driven ecommerce.
Does Google still send more traffic than ChatGPT?
Yes, by a wide margin. Across the cohort, Google organic delivered roughly 30x the session volume of ChatGPT to the median site over the window. ChatGPT was 2.77M sessions in the window versus far more for Google organic. Google processes roughly 8.5 billion searches per day; ChatGPT has around 800 million weekly active users. AI traffic is growing far faster — 13.4% compounded monthly for the cohort versus 1.1% for Google organic — but at current absolute levels Google is still the volume engine and AI is the intent engine.
Should I stop investing in Google SEO and focus on ChatGPT?
No, and the data is clear on why. Google organic still drives roughly 30x the volume in the cohort and remains the higher-converting channel on ecommerce. The correct framing is not "replace Google with AI" but "instrument both and let the recovered numbers drive the budget." Most SMBs under-count AI by 64% in GA4, so the realistic first step is measurement, not reallocation. For B2B SaaS the data justifies disproportionate new effort on AI-citable content; for ecommerce the existing SEO playbook still does most of the heavy lifting.
What is the bounce rate and time-on-page for ChatGPT traffic vs Google?
In the cohort, ChatGPT sessions show a lower bounce rate (38% vs 49% for Google organic on the same B2B SaaS pages), longer median time-on-page (2m 41s vs 1m 52s), and more pages per session (3.1 vs 2.2). The engagement gap is consistent with the intent-quality story: pre-informed visitors read more, navigate deeper, and bounce less. These are directional cohort medians, not site-level guarantees, and they are largest on deep content pages where AI traffic concentrates.
Does AI traffic from ChatGPT have a higher average order value than Google?
Yes. For ecommerce sites, ChatGPT first-transaction AOV was $87.40 versus $61.20 for Google organic — a 43% premium. For B2B SaaS, ChatGPT first-month subscription value was $44.10 versus $28.70 for Google organic — a 54% premium. Perplexity-sourced buyers spent even more ($112.40 AOV on ecommerce). The pattern holds across all four ecommerce sub-segments measured. Pre-informed buyers buy bigger plans and larger carts, which is part of why per-visit RPV runs higher for AI traffic even when conversion-rate gaps are modest.
Is the ChatGPT vs Google comparison the same for branded and non-branded queries?
No. The quality gap is concentrated in non-branded queries. On non-branded SaaS queries, ChatGPT converts at 3.4% versus Google organic at 1.3%. On branded queries the gap mostly closes — branded Google organic converts at 4.9% versus branded ChatGPT at 5.1%, essentially a tie. The reading: AI's edge is in the unbranded research phase where it pre-qualifies cold traffic, not in branded navigation where the user already decided. This is the single most important segmentation for interpreting the headline numbers honestly.
How does the ChatGPT vs Google comparison change by funnel stage?
ChatGPT over-indexes on mid- and bottom-funnel landing intent; Google organic over-indexes on top-funnel. In the cohort, 64% of ChatGPT sessions land on comparison, alternatives, pricing-adjacent, or evaluation pages versus 43% for Google organic. Because AI answers already synthesize the top-funnel education, the click that survives to your site is usually a later-stage one. That is why ChatGPT's conversion advantage is real per visit but the volume is smaller — AI compresses the funnel and hands you fewer, warmer clicks rather than many cold ones.
Can GA4 show me the ChatGPT vs Google traffic comparison?
Not by default, and not accurately even with a custom channel group. GA4 buckets 65-82% of ChatGPT visits into Direct/(none) because the ChatGPT client strips the Referer header, so the channel report shows ChatGPT as roughly zero while Google organic looks complete. A custom channel group regex recovers only the 15-20% of ChatGPT clicks that arrive with a referer. To run the comparison honestly you need server-side first-party attribution plus a Stripe revenue join, which is the architecture this benchmark is built on.
Will ChatGPT's conversion advantage over Google last?
Probably not at the current magnitude. The advantage is concentrated in non-branded research queries and depends on ChatGPT's user base skewing toward deliberate researchers. As ChatGPT broadens toward general-consumer use, that concentration dilutes and the per-visit gap compresses. Treat the 1.9x SaaS figure as a Q2-2026 snapshot, not a constant. The volume gap, meanwhile, is closing the other direction — AI grows at 13.4% monthly versus Google organic's 1.1% — so the two trends partially offset. Re-measure quarterly.
What is the methodology behind this 200-site comparison?
The comparison covers 200 Stripe-connected SMB sites tracked through Attrifast, with headline numbers from the rolling 30 days ending 2026-05-15. The cohort is 118 B2B SaaS, 54 ecommerce, 18 services/agencies, and 10 creators/publishers — roughly 41.2M sessions and 168k Stripe payment events joined server-side at the session-to-customer level. Every number ties to a Stripe webhook, not a vendor-reported impression. The sample skews bootstrapped, Stripe-native, US/EU SMBs and self-selected into Attrifast because they suspected un-attributed AI traffic, which likely inflates AI-share figures versus a random SMB sample.
Where can I read the full dataset behind this comparison?
The 2026 AI Search Revenue Benchmark is the parent study with the full per-engine breakdown across all five AI engines, geographic cuts, time-of-day patterns, and the complete methodology. This article is the ChatGPT-vs-Google head-to-head cut of that same dataset. For the attribution mechanics that make the comparison possible, why 70% of AI traffic hides in Direct walks the GA4 problem, and GA4's missing-traffic diagnostic helps you spot it on your own site.
Related reading from the Attrifast research stack
For more on connected topics, see ChatGPT vs Perplexity vs Claude Traffic, AI Citation Rate Benchmarks by Brand Size 2026, ChatGPT vs Perplexity for Business: Which AI Engine Drives More Revenue?, and ROAS vs MER vs RPV: The 2026 Marketing Metric Showdown. To dive deeper, explore AI citation tracking.
References
- SimilarWeb — AI Search Stats 2026: market share, referral, and citation data
- StatCounter — Search engine market share, desktop and mobile
- Cloudflare Radar — AI insights and bot traffic dashboard
- Backlinko — ChatGPT and AI search statistics
- Backlinko — How AI Overviews affect organic CTR
- Ahrefs — What triggers AI Overviews? 86 factors and 146 million SERPs analyzed (20.5% of SERPs, September 2025)
- BrightEdge — One Year Into Google AI Overviews: Google Search Usage Increases by 49%
- SparkToro — Zero-click search research
- Pew Research Center — Americans' use of generative AI
- OpenAI — Introducing ChatGPT search and usage disclosures
- Internet Live Stats — Google search statistics
- Ahrefs — Update: AI Overviews Reduce Clicks by 58%. 2026
- Semrush — AI search traffic research
- Profound — AI visibility platform
- eMarketer — AI search forecast
- The Verge — ChatGPT daily message volume coverage
- Reuters — OpenAI ChatGPT weekly active users coverage
- Plausible Analytics — How to track ChatGPT and AI search traffic
- Adobe Analytics — Traffic to U.S. retail websites from generative AI sources jumps 1,200 percent. March 2025
- Google Analytics — Default channel group definitions for GA4
- Stripe — Webhook delivery and idempotency
- seoClarity — Impact of Google's AI Overviews: SEO Research Study
For the full per-engine dataset, see the 2026 AI Search Revenue Benchmark. For the attribution mechanics, see why 70% of AI traffic hides in Direct, the track-ChatGPT-traffic guide, and track-Gemini-traffic. For the strategic budget split, see AEO vs SEO in 2026. To run this comparison on your own site, Attrifast's revenue attribution joins first-party sessions to Stripe, and the Attrifast vs Google Analytics comparison explains why GA4 cannot.