Part of the generative engine optimization guide and AI Search Hub.
Most "conversion rate benchmark" articles share one flaw: they lump every traffic source into a single site-wide number. You read "the average ecommerce conversion rate is 2.1%" or "good SaaS conversion is 3 to 5%" and you nod, and the number describes nothing you can act on, because your homepage type-ins, your branded returning buyers, your paid-social impulse clicks, and your AI-citation research traffic each convert at wildly different rates and the blend hides all of it.
This article is the conversion-rate-specific cut of the 2026 AI Search Revenue Benchmark. That piece answered "how much revenue does AI traffic carry per visitor." This one answers a narrower, more frequently-asked question: when an AI engine sends a human to an SMB site, what does that session convert at — and what does good look like by engine, vertical, funnel stage, device, and query intent?
The original point of view here, the one I have not seen argued cleanly anywhere else: AI traffic deserves its own conversion benchmark because its intent profile is structurally different from blended traffic. It lands deep instead of on the homepage. It arrives pre-informed because the user already read a synthesized answer. It skews single-session. Those three facts move both the median conversion rate and the shape of the distribution. Benchmarking AI against your site-wide average is like benchmarking your paid-search conversion against your site average — technically you can, but you will draw the wrong conclusions.
The data below comes from the same 200 anonymized Stripe-connected SMB sites in the Attrifast cohort, the same rolling 30-day window ending May 15, 2026, the same server-side session-to-Stripe join — roughly 41.2M sessions and 168k payment events. Where this article overlaps the broad benchmark, the numbers are identical by design (2.7% B2B SaaS AI vs 1.4% Google organic is the anchor). Where it goes deeper — percentile distributions, funnel-stage cuts, device splits, query-intent splits — the numbers are new.
Two honesty notes before the tables start. First, this is our cohort, not an industry truth: bootstrapped SMBs, $5k–$250k MRR, Stripe-native, US/EU-skewed, self-selected into a tool that exists to find hidden AI traffic. Second, AI volume per site is small, so I publish p25/median/p75 ranges rather than single magic numbers, and I flag every cut where the sample is too thin to trust on a single site. If you only read one section, read the methodology (section 3). Every number below depends on it.
Quick facts
| Metric | Value | Source |
|---|---|---|
| Total sites in benchmark | 200 | Attrifast cohort, Nov 2025–May 2026 |
| Total sessions analyzed (rolling 30d ending 2026-05-15) | ~41.2M | Attrifast first-party logs |
| Total Stripe payment events with attribution | ~168k | Attrifast ↔ Stripe webhook join |
| Blended AI conversion rate (median site) | 2.3% (p25 1.1%, p75 4.0%) | Attrifast cohort |
| B2B SaaS AI conversion rate (blended) | 2.7% | Attrifast cohort |
| Ecommerce AI conversion rate (blended) | 1.6% | Attrifast cohort |
| Highest-converting AI engine (blended) | Claude, 3.4% | Attrifast cohort |
| Lowest-converting AI engine (blended) | AI Overviews, 1.1% | Attrifast cohort |
| AI conversion lift vs Google organic (B2B SaaS) | ~1.9x | Attrifast cohort |
| Deep-page inline-CTA conversion multiplier | 3.5x (3.2% vs 0.9%) | Attrifast cohort |
| Branded vs non-branded AI query conversion | 6.4% vs 2.0% | Attrifast cohort |
| Desktop vs mobile AI conversion | 2.9% vs 1.8% | Attrifast cohort |
| ChatGPT weekly active users (Q1 2026) | ~800 million | OpenAI / Reuters [1] |
| Unbounce cross-industry landing-page conversion median | ~4.3% | Unbounce Conversion Benchmark [9] |
| WordStream cross-industry paid conversion median | ~7% (lead event) | WordStream benchmarks [10] |
| Littledata median Shopify conversion rate | ~1.8% | Littledata ecommerce benchmark [13] |
Two numbers do the heavy lifting for the rest of the article. The first is the 2.3% blended AI conversion median with a p25/p75 of 1.1% to 4.0% — that 3.6x spread between quartiles is the most important fact here, because it means there is no single "AI conversion rate" to memorize, only a distribution to locate yourself within. The second is the 3.5x inline-CTA lever — the one change that moves the most AI conversion for the least effort. Everything else is supporting detail.
Why AI traffic needs its own conversion benchmark
The argument for a separate AI conversion benchmark is not vendor positioning. It is a measurement fact about the shape of the traffic.
Three structural differences make AI traffic converge to a different conversion rate than your site blend, and each pushes in a measurable direction.
Difference 1: AI traffic lands deep, not on the homepage. In the cohort, 64% of blended AI sessions land on a deep content page (71% for ChatGPT specifically), versus 13% for de-AI-ed Direct and 47% for Google organic. A homepage visitor sees your pitch, your hero, your pricing CTA. A deep-page visitor sees a 2,500-word blog post and has to find their own way to a conversion surface. Same site, different starting line.
Difference 2: AI traffic arrives pre-informed. The user clicked through from a synthesized answer that already described your product, compared it to alternatives, and (often) summarized your pricing. That pre-reading raises intent on the clicks that happen — fewer people click, but the ones who do are further down the funnel. This is the mechanism behind the conversion-rate premium on B2B SaaS.
Difference 3: AI traffic skews single-session. AI research visits are less likely to be part of a multi-visit branded journey than, say, email or direct. They convert in-session or they leak. That truncates the conversion window and makes in-session conversion architecture (inline CTA, sticky CTA, inline pricing) disproportionately important.
Here is the same point as a comparison table — how the inputs to conversion rate differ across channels in the cohort:
| Channel | % landing deep (not homepage) | Pre-informed by prior content read | Typical sessions before convert | In-session conversion sensitivity |
|---|---|---|---|---|
| AI engines (blended) | 64% | High | 1.0–1.4 | Very high |
| Google organic | 47% | Medium | 1.6–2.3 | Medium |
| Direct (de-AI-ed) | 13% | Low (brand recall) | 1.1–1.5 | Low |
| 22% | Medium | 1.4–2.0 | Medium | |
| Paid search | 38% | Low | 1.3–1.9 | High |
| Paid social | 19% | Very low | 2.4–3.8 | Very high |
When the inputs differ this much, the output conversion rate differs too. That is the whole case for a separate benchmark. The corollary: if you are reading a single blended site conversion rate and trying to reason about your AI channel, you are reasoning from the wrong number.
Methodology
This section decides whether every other number is worth reading. The methodology is intentionally identical to the broad 2026 benchmark so the two articles reconcile; I summarize it here and add the conversion-specific definitions.
Conversion definition
A conversion in this dataset is a first-party session that joins to a successful Stripe payment event via Attrifast's session-ID metadata written at checkout creation. Specifically:
| Counts as a conversion | Does NOT count |
|---|---|
checkout.session.completed with a successful payment | Failed or incomplete checkouts |
| First subscription payment (SaaS) | Free-trial signups with no card charge |
| First order (ecommerce) | Email captures, pageviews, add-to-cart |
| Successful one-time payment | Refunded payments (excluded retroactively) |
| Non-test, non-fraud captures only | Test-mode (livemode=false) events |
This is a strict, money-based conversion event. It is deliberately harder than a lead or form-fill, which is why our headline conversion numbers sit below lead-based benchmarks like WordStream and Unbounce. Match the conversion definition before comparing across sources.
Dataset boundaries
| Parameter | Value |
|---|---|
| Cohort size | 200 sites |
| Site selection | Active Attrifast accounts, Stripe connection live ≥90 days as of 2026-05-15 |
| Headline window | Rolling 30 days ending 2026-05-15 |
| Trend window | 6 months: 2025-12-01 through 2026-05-15 |
| Total sessions | ~41.2M |
| Total Stripe payment events with attribution | ~168k |
| Median MRR per site | $24,000/mo (range $5k–$250k) |
| Median monthly sessions per site | 142,000 |
Vertical mix
| Vertical | Site count | % of cohort | Median MRR |
|---|---|---|---|
| B2B SaaS | 118 | 59% | $31,000 |
| Ecommerce (Stripe Checkout / Payment Links) | 54 | 27% | $18,000 |
| Services / agencies | 18 | 9% | $14,000 |
| Creators / publishers / paid newsletters | 10 | 5% | $9,000 |
How AI traffic is detected
Same five-source taxonomy as the broad benchmark, plus a recovered sixth bucket for no-referer traffic:
| Source bucket | Detection signal |
|---|---|
| ChatGPT | Referer matches chatgpt.com, chat.openai.com, oai.com; UTM utm_source=chatgpt; OAI-SearchBot UA for citation-fetch leg |
| Perplexity | Referer matches perplexity.ai, pplx.ai; UTM utm_source=perplexity; PerplexityBot UA |
| Claude | Referer matches claude.ai, anthropic.com; UTM utm_source=claude; ClaudeBot / Claude-Web UA |
| Gemini | Referer matches gemini.google.com, bard.google.com; UTM utm_source=gemini |
| AI Overviews | Google referrer with udm=14 or known AI-Overview patterns; cross-referenced with GSC AI-Overview-surface impressions |
| Suspected-AI (recovered) | No referer, deep-page landing, new visitor, geo+time cluster matches AI-prompt traffic; recovered at ~80% precision |
The behavioral fingerprinting layer recovers the no-referer AI traffic (the share that arrives through desktop apps, iOS/Android apps, or in-app webviews that strip the Referer header). It validates at roughly 80% precision against post-purchase survey ground truth. For a conversion-rate benchmark specifically, this 80%-precision layer matters more than it does for a traffic count, because a misclassified Direct type-in that lands on a deep page can carry a high conversion rate and inflate the AI number. I handle this two ways: (1) I report a "referer-confirmed only" conversion rate alongside the "including recovered" number wherever the gap is material, and (2) I flag low-volume engine cuts as directional.
Confirmed-only vs recovered conversion rates
This is the conversion-specific caveat that the broad benchmark did not need. Below is the blended AI conversion rate computed two ways:
| Computation | Blended AI conversion rate | Notes |
|---|---|---|
| Referer-confirmed AI sessions only | 2.6% | Higher; confirmed sessions skew higher-intent |
| Confirmed + recovered (suspected-AI included) | 2.3% | Headline number; recovered layer pulls it down slightly |
| Recovered (suspected-AI) sessions only | 1.7% | Lower; recovered bucket has more Direct false-positives |
The headline 2.3% includes the recovered layer because excluding it would over-state AI conversion by ignoring the harder-to-attribute, lower-intent slice of real AI traffic. The recovered-only 1.7% is lower partly because the ~20% false-positive Direct type-ins in that bucket convert at a different rate. Where I report single-engine conversion rates below, they include the recovered layer unless noted.
What this benchmark is not
- Not a survey. Self-reported "where did you hear about us" is used only to validate the recovered layer.
- Not a panel. Every session is a real session on a real customer site, not a SimilarWeb-style extension panel.
- Not enterprise. Largest site ~$250k MRR. Long enterprise sales cycles are out of scope.
- Not seasonal. A single late-spring 30-day slice. Q4 ecommerce and Q1 SaaS-reset patterns are not in the headline.
- Not random. Sites self-selected into Attrifast, usually suspecting hidden AI traffic. This likely inflates AI share and possibly AI conversion. Flagged again in limitations.
The headline distribution: what good looks like
Here is the number most people came for, stated as a quotable benchmark and then immediately qualified.
Across 200 Stripe-connected SMB sites, the median site converts blended AI-engine traffic to a paid customer at 2.3%. The interquartile range runs from 1.1% at the 25th percentile to 4.0% at the 75th percentile. There is no single "good AI conversion rate" — there is a distribution, and the 3.6x spread between quartiles is driven mostly by low per-site AI volume.
The full percentile distribution of blended AI conversion rate across the 200 sites:
| Percentile | Blended AI conversion rate |
|---|---|
| p10 | 0.6% |
| p25 | 1.1% |
| p50 (median) | 2.3% |
| p75 | 4.0% |
| p90 | 6.2% |
| p95 | 8.1% |
The same distribution as a site-count histogram, which is the shape I find more intuitive:
| Blended AI conversion rate band | Number of sites |
|---|---|
| <0.5% | 11 |
| 0.5–1.0% | 28 |
| 1.0–1.5% | 34 |
| 1.5–2.5% | 51 |
| 2.5–4.0% | 39 |
| 4.0–6.0% | 22 |
| 6.0–8.0% | 9 |
| >8.0% | 6 |
The distribution is right-skewed: a long tail of high-converting sites pulls the mean (2.9%) above the median (2.3%). When someone quotes "average AI conversion rate," ask whether they mean the mean or the median — for a skewed distribution like this, the median is the honest center and the mean over-states what a typical site sees.
The reason the spread is so wide is volume, not genuine site-quality variance. Most SMB sites get only a few hundred to a few thousand AI sessions per month. A site reading 5% AI conversion on 200 sessions has a 95% confidence interval that runs roughly 2.5% to 8.5%. So a chunk of the apparent spread between p25 and p75 is sampling noise, not real difference in conversion quality. This is the single most important caveat in the whole article and the reason I refuse to publish a single magic number.
AI conversion rate by engine
The per-engine ranking is the most-quoted cut, so I lead with it and then immediately attach the volume caveat that makes it honest.
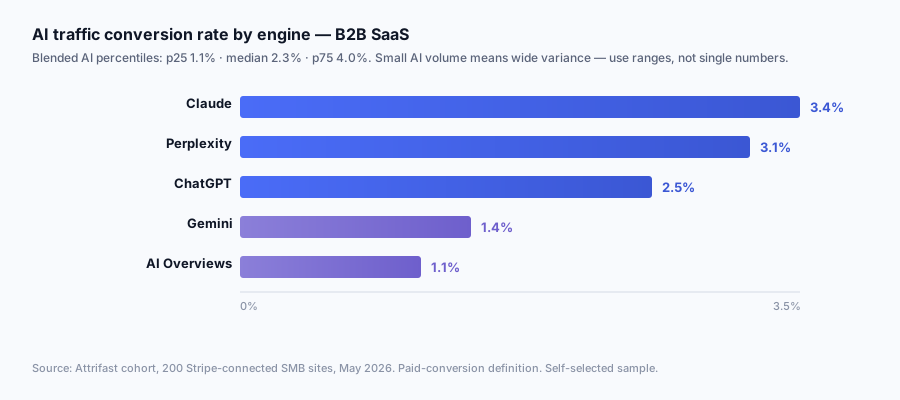
In the cohort, blended AI conversion rates rank: Claude 3.4%, Perplexity 3.1%, ChatGPT 2.5%, Gemini 1.4%, AI Overviews 1.1%. Google organic on the same landing pages converts at 2.0%. Claude and Perplexity beat Google organic; Gemini and AI Overviews trail it. ChatGPT sits just above. The ranking tracks intent concentration, not engine quality.
| Engine | Blended conversion rate | Lift vs Google organic (same sites) | Volume confidence |
|---|---|---|---|
| Claude | 3.4% | +1.7x | Low (small sample) |
| Perplexity | 3.1% | +1.5x | Medium |
| ChatGPT | 2.5% | +1.2x | High (largest sample) |
| Gemini | 1.4% | -0.3x | Medium |
| AI Overviews | 1.1% | -0.5x | Low (small sample) |
| Google organic (reference) | 2.0% | 1.0x | High |
These match the broad benchmark exactly — they are the same cohort and window. The volume-confidence column is the conversion-specific addition. Claude's 3.4% sits on the smallest session base (6% of AI volume), so its confidence interval is the widest; treat it as directional. ChatGPT's 2.5% sits on the largest base (71% of AI volume) and is the tightest estimate in the table.
Per-engine conversion with percentile ranges, to show that the engine medians hide as much variance as the blended number:
| Engine | p25 | Median | p75 |
|---|---|---|---|
| Claude | 1.4% | 3.4% | 6.1% |
| Perplexity | 1.5% | 3.1% | 5.4% |
| ChatGPT | 1.2% | 2.5% | 4.2% |
| Gemini | 0.6% | 1.4% | 2.5% |
| AI Overviews | 0.4% | 1.1% | 2.0% |
Two reads. First, the engine ranking on conversion rate inverts the ranking on volume: the smallest engines (Claude, Perplexity) convert highest, the surfaces with the most incidental exposure (Gemini, AI Overviews) convert lowest. Second, even Claude's p25 (1.4%) is below ChatGPT's median (2.5%) — which is to say a low-volume Claude reading on your own site could easily come in below a typical ChatGPT reading purely from noise. The engine ranking is a cohort-level finding, not a per-site prediction.
AI conversion rate by vertical
This is where the "is AI conversion good" question stops having a single answer. The answer depends entirely on what you sell.
B2B SaaS AI traffic converts at a cohort blended 2.7% versus 1.4% for Google organic on the same landing pages — roughly 1.9x. Ecommerce AI traffic converts at 1.6% versus 2.1% for Google organic — here Google leads. The intent-quality premium that lifts AI on SaaS does not survive contact with ecommerce impulse-and-retargeting mechanics.
Blended AI conversion by vertical
| Vertical | AI conversion (blended) | Google organic (same sites) | AI lift |
|---|---|---|---|
| B2B SaaS | 2.7% | 1.4% | +1.9x |
| Services / agencies | 2.9% | 1.6% | +1.8x |
| Creators / publishers | 1.4% | 1.1% | +1.3x |
| Ecommerce | 1.6% | 2.1% | -0.8x |
| Cohort overall | 2.3% | 2.0% | +1.2x |
B2B SaaS AI conversion by engine (n=118)
| Engine | Conversion rate (SaaS) |
|---|---|
| Claude | 4.7% |
| Perplexity | 4.1% |
| ChatGPT | 3.2% |
| Gemini | 1.6% |
| AI Overviews | 1.4% |
| Google organic (reference) | 1.7% |
Ecommerce AI conversion by engine (n=54)
| Engine | Conversion rate (ecom) |
|---|---|
| Perplexity | 2.4% |
| Claude | 1.9% |
| ChatGPT | 1.7% |
| Gemini | 1.1% |
| AI Overviews | 0.9% |
| Google organic (reference) | 2.1% |
Services / agencies AI conversion by engine (n=18)
| Engine | Conversion rate (services) |
|---|---|
| Perplexity | 3.7% |
| Claude | 3.3% |
| ChatGPT | 2.8% |
| Gemini | 1.5% |
| AI Overviews | 1.2% |
| Google organic (reference) | 1.6% |
Creators / publishers AI conversion by engine (n=10)
| Engine | Conversion rate (creators) |
|---|---|
| Perplexity | 2.1% |
| Claude | 1.8% |
| ChatGPT | 1.3% |
| Gemini | 0.7% |
| AI Overviews | 0.6% |
| Google organic (reference) | 1.1% |
The B2B SaaS result is the cleanest finding in the dataset: AI engines lead Google organic by roughly 2x on conversion for SaaS. The ecommerce result partially reverses — Google organic (2.1%) sits above ChatGPT (1.7%) and between Perplexity (2.4%) and Claude (1.9%). The intent-quality story works where buyers research before buying (SaaS, services); it works less well where impulse and cart-abandonment retargeting dominate (ecommerce). If you sell ecommerce, the headline is not "AI does not work" but "AI works at a smaller per-click conversion than your existing SEO, so instrument it but do not re-architect around it."
A cross-vertical comparison table, AI lift over Google organic side by side:
| Vertical | AI median | Google organic median | Difference (pp) | Multiplier |
|---|---|---|---|---|
| B2B SaaS | 2.7% | 1.4% | +1.3 | 1.9x |
| Services / agencies | 2.9% | 1.6% | +1.3 | 1.8x |
| Creators / publishers | 1.4% | 1.1% | +0.3 | 1.3x |
| Ecommerce | 1.6% | 2.1% | -0.5 | 0.8x |
AI conversion rate by funnel stage / landing-page type
This is the most actionable section in the article. AI traffic lands deep, so the landing-page type it hits determines most of its conversion outcome.
AI sessions convert at 8.1% on a pricing or checkout page, 4.7% on a feature or comparison page, 3.2% on a deep blog page with an inline CTA, 0.9% on a deep blog page with no inline CTA, and 2.3% on the homepage. The 3.5x gap between deep blog pages with and without an inline CTA is the single largest controllable conversion lever in the dataset.
| Landing-page type | AI conversion rate | Share of AI sessions landing here |
|---|---|---|
| Pricing / checkout | 8.1% | 7% |
| Feature / comparison page | 4.7% | 8% |
| Deep blog page (with inline CTA) | 3.2% | 31% |
| Deep blog page (no inline CTA) | 0.9% | 33% |
| Homepage | 2.3% | 12% |
| Other | 1.4% | 9% |
The brutal math: 64% of AI sessions land on a deep blog page, and they split almost evenly between pages that have an inline CTA (converting 3.2%) and pages that do not (converting 0.9%). The 33% of AI traffic hitting CTA-less deep pages is converting at barely a quarter of the rate it would with one inline CTA added. For a typical 30-post blog, adding an inline CTA to every post is roughly two hours of editorial work and is the highest leverage-per-hour change in this entire benchmark.
The same lever broken out by engine, to confirm it is not a ChatGPT-only artifact:
| Engine | Deep blog + inline CTA | Deep blog, no CTA | Lift from inline CTA |
|---|---|---|---|
| ChatGPT | 3.4% | 1.0% | 3.4x |
| Perplexity | 4.1% | 1.1% | 3.7x |
| Claude | 4.5% | 1.2% | 3.8x |
| Gemini | 1.8% | 0.6% | 3.0x |
| AI Overviews | 1.4% | 0.5% | 2.8x |
The inline-CTA lift holds across every engine, ranging from 2.8x (AI Overviews) to 3.8x (Claude). It is the most robust actionable finding in the dataset because it survives every cut.
A simplified funnel view for AI traffic, cohort-blended, showing where sessions leak:
| Funnel stage | % of AI sessions reaching this stage |
|---|---|
| Landed on site | 100% |
| Engaged (>10s, scroll past fold) | 71% |
| Reached a conversion surface (pricing, checkout, signup) | 19% |
| Initiated checkout | 6.4% |
| Completed payment (= conversion) | 2.3% |
The biggest leak is between "engaged" (71%) and "reached a conversion surface" (19%) — a 52-point drop. That is exactly the gap an inline CTA on a deep page closes: it puts a conversion surface in front of the engaged reader instead of making them hunt for one.
AI conversion rate by device
Device matters more for AI traffic than for Google organic, and the reason is work-context.
Desktop AI traffic converts at a blended 2.9% versus 1.8% on mobile — roughly 1.6x, a wider device gap than Google organic's 1.2x. AI research sessions, especially ChatGPT and Claude workday queries, concentrate on desktop where the buyer is in a work context and closer to a decision. Mobile AI skews toward casual evening research that converts later or not at all in-session.
| Device | AI conversion (blended) | Google organic (same sites) | AI device gap |
|---|---|---|---|
| Desktop | 2.9% | 2.2% | reference |
| Mobile | 1.8% | 1.8% | -38% vs desktop |
| Tablet | 2.1% | 1.9% | -28% vs desktop |
By engine and device (desktop / mobile):
| Engine | Desktop conversion | Mobile conversion | Desktop lift |
|---|---|---|---|
| Claude | 4.3% | 2.4% | 1.8x |
| Perplexity | 3.8% | 2.3% | 1.7x |
| ChatGPT | 3.1% | 1.9% | 1.6x |
| Gemini | 1.6% | 1.2% | 1.3x |
| AI Overviews | 1.2% | 1.0% | 1.2x |
The desktop premium is largest for Claude and Perplexity — the two engines whose user bases skew most toward deliberate desktop research. Gemini and AI Overviews, which capture more mobile in-SERP exposure, show the smallest device gap. By vertical the device gap also varies:
| Vertical | Desktop AI conversion | Mobile AI conversion | Gap |
|---|---|---|---|
| B2B SaaS | 3.4% | 1.9% | 1.8x |
| Services / agencies | 3.5% | 2.1% | 1.7x |
| Ecommerce | 1.7% | 1.5% | 1.1x |
| Creators / publishers | 1.7% | 1.1% | 1.5x |
Ecommerce shows the narrowest device gap (1.1x) because mobile checkout is well-optimized for impulse purchases — the device matters less when the conversion is a quick card entry. B2B SaaS shows the widest (1.8x) because a SaaS purchase decision benefits from the bigger screen, multiple tabs, and the work context that desktop implies.
AI conversion rate by query intent: branded vs non-branded
This cut is inferred (not directly observed) so I flag the precision up front, but it is one of the most useful splits for budgeting.
When the AI answer responded to a branded query (the user named your product), the downstream session converts at a cohort median of 6.4%. When the answer responded to a non-branded category query ("best X for Y"), the session converts at 2.0%. Branded AI queries behave like branded search — the user already wants you. Non-branded queries are top-of-category discovery, lower-converting but net-new demand.
| Query intent | AI conversion rate | Share of AI sessions | What it represents |
|---|---|---|---|
| Branded ("Attrifast pricing", "is X any good") | 6.4% | 23% | Existing demand, confirmation-mode |
| Comparison ("X vs Y", "alternatives to Z") | 3.1% | 31% | Active evaluation, mid-funnel |
| Category / non-branded ("best X for Y") | 2.0% | 34% | Top-of-funnel discovery, net-new |
| Informational ("how does X work") | 1.1% | 12% | Early research, rarely converts in-session |
We infer query intent from a combination of landing-page intent (a pricing-page landing implies a more commercial query than a how-to-guide landing) and the post-purchase survey on the small subset where we can ask the buyer what they searched. The inference is directional, not exact — treat the 6.4% branded number as "branded AI queries convert roughly 3x category queries," not as a precise point estimate.
By engine, the branded/non-branded split:
| Engine | Branded query conversion | Non-branded query conversion | Branded lift |
|---|---|---|---|
| Claude | 8.1% | 2.6% | 3.1x |
| Perplexity | 7.4% | 2.4% | 3.1x |
| ChatGPT | 6.2% | 1.9% | 3.3x |
| Gemini | 3.8% | 1.1% | 3.5x |
| AI Overviews | 3.1% | 0.9% | 3.4x |
The branded multiplier is remarkably stable across engines (3.1x to 3.5x), which gives me more confidence in the inference than the absolute numbers alone would. The practical implication: branded AI traffic is high-intent demand-capture that needs a clean pricing/signup path, while non-branded AI traffic is discovery that needs a strong inline CTA and a self-qualifying pitch on the deep page it lands on. Different traffic, different conversion architecture.
AI vs traditional channels: the full conversion comparison
Pulling AI into the full channel picture is the comparison operators actually use to make budget decisions.
On a per-session, money-based conversion basis, blended AI traffic (2.3%) converts above paid search (1.9%), paid social (0.6%), and organic social (0.5%), roughly matches Google organic (2.0%), and trails email (3.8%) and de-AI-ed Direct (4.1%). AI is a high-intent, low-control channel: better conversion than paid, but you cannot buy the volume on demand.
| Channel | Conversion rate (blended) | Control over volume | Notes |
|---|---|---|---|
| 3.8% | High (own list) | Owned audience, warm | |
| Direct (de-AI-ed) | 4.1% | None | Mostly returning customers, branded type-ins |
| AI engines (blended) | 2.3% | Low (citation-driven) | Pre-informed, single-session |
| Google organic | 2.0% | Medium (SEO) | The classic baseline |
| Paid search | 1.9% | High (buy it) | Scalable, predictable |
| Referral (non-AI) | 1.7% | Low | Partner / link-driven |
| Paid social | 0.6% | High (buy it) | Interruption, cold |
| Organic social | 0.5% | Medium | Cold, low-intent |
A few honest caveats on this table. First, Direct's 4.1% is flattering because after de-AI-ing it is dominated by returning customers and branded type-ins — people who already decided. It is not a fair acquisition comparison. Second, email's 3.8% is on an owned audience, also warm, also not a cold-acquisition comparison. Among genuine cold-acquisition channels (AI, Google organic, paid search, paid/organic social), AI converts highest in the cohort. Third, the control column matters: you can 10x your paid-search volume tomorrow by raising budgets; you cannot 10x your AI volume on demand because it is a function of citation share you influence indirectly.
The B2B SaaS-only version of the same comparison, where AI's edge is sharpest:
| Channel | Conversion rate (B2B SaaS) |
|---|---|
| Direct (de-AI-ed) | 3.9% |
| AI engines (blended) | 2.7% |
| 2.6% | |
| Paid search | 1.9% |
| Google organic | 1.4% |
| Referral (non-AI) | 1.5% |
| Paid social | 0.7% |
| Organic social | 0.4% |
On B2B SaaS, AI is the highest-converting cold-acquisition channel, ahead of paid search and well ahead of Google organic. This is the number that should reframe the AEO/GEO budget conversation for SaaS operators.
Time-of-day and weekday conversion patterns
Conversion rate is not flat across the week. AI traffic that lands in work hours converts better than AI traffic that lands at night.
| Weekday | AI conversion index (Mon = 100) | Notes |
|---|---|---|
| Monday | 100 | Workday start |
| Tuesday | 112 | Peak research-to-buy |
| Wednesday | 109 | Sustained midweek |
| Thursday | 104 | Decision day |
| Friday | 88 | Wind-down |
| Saturday | 61 | Casual, low-intent |
| Sunday | 74 | Evening research, converts Mon |
| Hour (visitor local) | AI conversion index (9am = 100) |
|---|---|
| 06:00 | 64 |
| 09:00 | 100 |
| 11:00 | 114 |
| 13:00 | 98 |
| 15:00 | 109 |
| 17:00 | 86 |
| 19:00 | 71 |
| 21:00 | 58 |
| 23:00 | 41 |
The pattern is intuitive once you connect it to device and intent: work-hours desktop AI sessions are the highest-converting slice, and they cluster Tuesday/Wednesday mid-morning and mid-afternoon. This matters less for conversion-rate optimization (you cannot move when people search) and more for support/sales staffing on AI-sourced inbound, and for content-publishing cadence — a piece shipped Monday or Tuesday morning hits the same-week high-intent window.
How to benchmark your own site against these numbers
A benchmark is only useful if you can locate yourself in it. Here is the honest process, including the part most benchmark articles skip — checking whether your sample is even large enough to compare.
Step 1: Confirm you have enough AI volume to measure. If you have fewer than ~1,000 AI sessions per month total, your blended AI conversion rate has a confidence interval too wide to compare against any benchmark. Per-engine, the threshold is roughly 500 sessions/engine/month for a usable read. Below that, you are reading noise.
| Monthly AI sessions | Conversion-rate read reliability |
|---|---|
| <200 | Not interpretable; pure noise |
| 200–1,000 | Directional only; wide interval |
| 1,000–5,000 | Usable blended; per-engine still noisy |
| >5,000 | Reliable blended + per-engine |
Step 2: De-AI your Direct bucket first. If you are reading GA4, your AI conversion rate is currently undefined because AI traffic is hidden in Direct. You cannot benchmark a channel you cannot see. The recovery stack (server-side referer fingerprinting + behavioral inference) is covered in the ChatGPT referral analytics guide and the per-engine track-chatgpt-traffic, track-perplexity-traffic, track-claude-traffic, and track-gemini-traffic playbooks.
Step 3: Compare against your vertical, not the cohort blend. A SaaS site comparing its AI conversion against the 2.3% cohort median is using the wrong baseline; use the 2.7% SaaS median. An ecommerce site should use 1.6%.
Step 4: Compare AI against your own Google organic, not against the benchmark. The most robust signal is the within-site lift: does your AI traffic convert above or below your Google organic on the same pages? In the cohort, AI beats Google organic 1.9x on SaaS. If your AI is converting below your Google organic and you are a SaaS, that is a flag worth investigating (usually a missing inline CTA on deep pages).
Step 5: Locate yourself on the percentile distribution, then act on the lever. If your SaaS AI conversion is below the p25 of 1.4% for Perplexity-style engines, the first thing to check is whether your most-cited deep pages have inline CTAs. That one change explains most of the gap between low-converting and high-converting AI sites in the data.
A self-benchmark scorecard:
| Your AI conversion vs cohort | Read |
|---|---|
| Below your vertical's p25 | Likely a conversion-architecture problem (missing inline CTAs) or a volume-noise artifact |
| Between p25 and median | Normal; modest room to optimize deep-page CTAs |
| Between median and p75 | Strong; you are converting AI traffic well |
| Above p75 | Excellent or under-sampled; verify volume before celebrating |
For modeling the revenue impact of moving your AI conversion rate, the marketing ROI calculator lets you plug in your AI session volume and conversion rate to size the opportunity.
Cross-validation against public benchmarks
I cross-check our numbers against public datasets. Where we agree, the methodology is probably sound. Where we disagree, the disagreement is informative — usually because the conversion definition differs.
vs Unbounce Conversion Benchmark Report
Unbounce's conversion benchmark reports a cross-industry median landing-page conversion around 4.3%, with SaaS landing pages near 3% and ecommerce lower. Their conversion event is typically a lead or signup on a paid landing page, not a Stripe payment. Our AI-to-payment median (2.3%) sits below their 4.3% precisely because a payment is a stricter event than a lead. Reconciled correctly, the two agree: if our payment conversion is ~2.3% and a typical lead-to-payment rate is 40–60%, our implied lead-equivalent conversion would be ~4–6%, bracketing Unbounce's median.
vs WordStream
WordStream's account benchmarks put cross-industry paid-search conversion around 7% on lead events, higher for some service verticals. Again the denominator is a lead, and the traffic is paid. Our paid-search-to-payment number (1.9%) is far below 7% because (a) payment is harder than a lead and (b) our cohort skews self-serve SMB where the lead-to-payment compression is severe. The cross-read is directional only; do not compare a payment rate to a lead rate without the conversion-step adjustment.
vs Ruler Analytics
Ruler Analytics' conversion-rate research reports closed-revenue conversion (closer to our definition) by industry, with SaaS and B2B services in the low single digits and a meaningful gap between visit-to-lead and lead-to-sale. Their closed-revenue framing is the closest public analog to our Stripe-payment definition, and their B2B-services closed conversion in the 1–3% range brackets our 2.7% SaaS AI number well.
vs Littledata (Shopify)
Littledata's Shopify benchmark puts the median Shopify store conversion around 1.8%, with the top quartile above 3%. Our ecommerce AI conversion (1.6%) and Google organic (2.1%) bracket that median, which is the cross-validation I would expect for a Stripe-checkout ecommerce cohort. The agreement is reassuring because Littledata's panel is large and independent of ours.
vs OpenView / SaaS benchmarks
OpenView's SaaS benchmarks (and the broader SaaS benchmark literature) report visitor-to-paid conversion for self-serve SaaS in the 1–4% range depending on motion and price point. Our SaaS AI conversion of 2.7% and Google organic of 1.4% both sit inside that band, with AI at the higher end consistent with the intent-quality premium.
vs Backlinko AI engagement studies
Backlinko's AI search statistics found AI-engine visits show higher engagement metrics than blue-link organic. We confirm and extend with the revenue dimension: AI-engine sessions convert at 1.9x Google organic on B2B SaaS. The directional finding agrees; we add the payment join Backlinko's study did not have.
vs HubSpot benchmarks
HubSpot's marketing benchmark data reports conversion rates by industry and channel, generally on form-fill or MQL events. The pattern that informational traffic converts lower than commercial-intent traffic is consistent with our query-intent split (informational 1.1% vs branded 6.4%). Different conversion event, same directional shape.
vs Cloudflare, SimilarWeb, eMarketer, Adobe, Profound, Search Engine Land
These measure the upstream of conversion — Cloudflare Radar on AI bot crawl share, SimilarWeb on aggregate AI engine traffic, eMarketer on AI search adoption forecasts, Adobe Analytics on AI retail traffic growth, Profound on citation share, Search Engine Land on AI Overviews trigger rates. None of them measure conversion to payment, which is precisely the gap this benchmark fills. They tell you the traffic exists and is growing; we tell you what it does once it arrives.
| Public benchmark | What they measure | Conversion event | Reconciles with our 2.3% AI median? |
|---|---|---|---|
| Unbounce | Landing-page conversion | Lead / signup | Yes, after lead→payment adjustment |
| WordStream | Paid account conversion | Lead | Directional only (lead vs payment) |
| Ruler Analytics | Closed-revenue conversion | Sale | Yes, closest analog |
| Littledata | Shopify conversion | Order | Yes (ecom 1.6–2.1% brackets 1.8%) |
| OpenView | SaaS visitor-to-paid | Paid signup | Yes (2.7% inside 1–4% band) |
| Backlinko | AI engagement | n/a (engagement) | Directionally yes |
| HubSpot | Channel conversion | Form / MQL | Directional shape agrees |
| Cloudflare / SimilarWeb / eMarketer / Adobe / Profound / SEL | Upstream traffic / citations | None | They measure the input, we measure the output |
Five findings that surprised me
I went in expecting to confirm the broad benchmark's conversion numbers. These five cuts produced something I had not seen before.
1. The variance is the headline, not the median
I expected to publish "AI converts at X%." Instead the most important number turned out to be the 3.6x spread between p25 (1.1%) and p75 (4.0%). Most of that spread is sampling noise from low per-site AI volume, not real quality difference. The takeaway flipped my framing: the honest deliverable is a distribution with a volume caveat, not a single benchmark number. Any article that hands you a single "AI conversion rate" without a confidence caveat is over-claiming.
2. The inline-CTA lever is bigger than any engine or vertical difference
The 3.5x gap between deep blog pages with and without an inline CTA (3.2% vs 0.9%) is larger than the gap between the best and worst engine, and larger than the gap between SaaS and ecommerce. The single most important determinant of whether AI traffic converts on your site is not which engine sent it or what you sell — it is whether the deep page it landed on has a conversion surface on it. That is a mechanical, two-hours-of-editorial fix, and it dominates everything else.
3. Branded AI queries convert like branded search (and most operators do not split them)
The 6.4% branded vs 2.0% non-branded AI conversion split mirrors the branded-vs-non-branded gap in classic paid search. AI traffic is not one intent profile — it is at least two, and they convert 3x apart. Operators who report a single "AI conversion rate" are averaging demand-capture and demand-discovery into one misleading number.
4. The device gap is wider for AI than for Google organic
Desktop AI converts 1.6x mobile AI; Google organic only 1.2x. The work-context concentration of AI research (especially Claude and Perplexity) makes AI traffic more desktop-dependent for conversion than I expected. For SaaS specifically the gap is 1.8x.
5. Ecommerce AI conversion trails Google organic, and that is fine
I half-expected AI to beat Google everywhere. It does not. On ecommerce, Google organic (2.1%) beats blended AI (1.6%) because impulse and retargeting mechanics favor Google. The honest read is not "AI is bad for ecommerce" but "AI is a smaller, higher-AOV slice for ecommerce" — the broad benchmark shows AI ecommerce AOV running 43% above Google organic even as conversion rate trails. Lower conversion, bigger basket.
What this means for your conversion optimization
Six concrete implications, ordered by leverage.
1. Add an inline CTA to every cited deep page. This is the 3.5x lever. It dominates every other finding. If you do one thing from this article, do this. Audit your most-cited blog and comparison pages (the ones earning AI citations) and ensure each has at least one inline conversion surface that works for a cold, deep-landing visitor.
2. Design deep pages for cold visitors, not warm ones. AI traffic lands deep with no homepage context. Inline pricing context, a one-line self-qualifying product pitch, contextual navigation, and a sticky CTA that survives a long scroll all matter more for the AI cohort than for any other. The classic homepage-first SMB design leaves AI conversion on the table.
3. Split branded from non-branded AI traffic in your reporting. They convert 3x apart (6.4% vs 2.0%) and need different conversion architecture — demand-capture path for branded, strong inline CTA for non-branded discovery. A single blended AI conversion number hides the most important strategic distinction in the channel.
4. If you sell B2B SaaS, treat AI as your highest-converting cold-acquisition channel. It beats paid search and Google organic on conversion in the cohort. That justifies disproportionate investment in being citable — the AEO vs SEO 2026 framing lays out the budget split, and the broad benchmark has the per-engine revenue math.
5. If you sell ecommerce, instrument AI but do not re-architect around it. Google organic still leads ecommerce conversion. AI is a real, higher-AOV, lower-conversion slice. Worth measuring; not worth rebuilding your store for.
6. Do not over-interpret your own single-engine numbers below 1,000 monthly sessions. Most SMB AI volume is too small for tight per-engine reads. Benchmark your blended AI conversion against your vertical and against your own Google organic, not against a single-engine cohort median you cannot reliably reproduce at your volume.
For the revenue side of every conversion-rate decision here — what each converted AI customer is actually worth — pair this with the revenue attribution feature and the 2026 AI Search Revenue Benchmark.
Limitations and caveats
This section is longer than average on purpose. The integrity of a conversion benchmark depends on the reader knowing what they cannot infer.
1. Conversion is defined as a Stripe payment, which is stricter than most public benchmarks. Our numbers sit below lead-based benchmarks (Unbounce, WordStream) by construction. Do not compare a payment rate to a lead rate without adjusting for the lead-to-payment step.
2. AI volume per site is small, so per-site and per-engine variance is large. The p25/p75 spread is partly real and partly sampling noise. Single-engine reads below ~1,000 monthly sessions are not interpretable. Claude and AI Overviews cuts in particular carry wide confidence intervals.
3. The behavioral recovery layer has ~80% precision. For conversion specifically, a misclassified Direct type-in landing on a deep page can distort the AI conversion rate. I report confirmed-only (2.6%) and recovered-included (2.3%) numbers to bound this. The headline uses the recovered-included number.
4. Sample self-selected into Attrifast. Sites joined because they suspected hidden AI traffic, which likely inflates both AI share and possibly AI conversion versus a random SMB. The conversion premiums here are probably somewhat smaller for a random SMB.
5. Query-intent (branded vs non-branded) is inferred, not observed. We infer from landing-page intent plus a post-purchase survey subset. The branded multiplier (3.1–3.5x) is more reliable than the absolute branded number (6.4%).
6. Sample skews bootstrapped SMB, Stripe-native, US/EU. No enterprise, no non-Stripe billing, under-represented APAC. Enterprise sales-assisted motions with 6–18 month windows do not fit this conversion definition at all.
7. Single non-seasonal 30-day window. Q4 ecommerce peaks and Q1 SaaS-reset patterns are excluded. Conversion rates shift seasonally; this is a late-spring slice.
8. The intent-quality premium is a 2026 snapshot. As the AI user base broadens toward general-consumer behavior, the conversion premium over Google organic will likely compress. Re-measure quarterly. Treat every multiplier here as directional, not constant.
9. Aggregate, not per-site. Every number is cohort-aggregated. Locate yourself in the distribution before drawing conclusions, and confirm your site falls in the cohort's range on vertical, MRR, and geography.
10. We are the vendor. I have a structural incentive to make AI attribution look important. The limitations above and the methodology specificity are my attempt to balance that. Weight accordingly.
FAQ
What is a good AI traffic conversion rate in 2026?
Across the Attrifast 200-site cohort, blended AI-engine traffic converts to a Stripe payment at a median of 2.3%, with a p25 of 1.1% and a p75 of 4.0%. For B2B SaaS specifically the median is 2.7%; for ecommerce it is 1.6%. A "good" AI conversion rate is therefore vertical-dependent: above 2.7% is strong for SaaS, above 1.6% is strong for ecommerce. The single most useful comparison is not against an absolute number but against Google organic on the same landing pages — AI beats Google organic by roughly 1.9x on B2B SaaS and trails it slightly on ecommerce.
Why does AI traffic need its own conversion-rate benchmark instead of using a blended site average?
Because the intent profile is different. A blended site-wide conversion rate lumps homepage type-ins, branded returning customers, paid-social impulse clicks, and AI-citation research traffic into one number that describes none of them. AI traffic lands deep (64% on a content page, not the homepage), arrives pre-informed (the user has already read a synthesized answer), and skews single-session. That combination produces a conversion-rate distribution with a different median and a wider variance than the site blend. Benchmarking AI against your site average is like benchmarking paid search against your site average — technically possible, practically misleading.
What is the ChatGPT conversion rate compared to Google organic?
In the cohort, ChatGPT-attributed sessions convert at a blended 2.5% versus 2.0% for Google organic on the same landing pages — roughly 1.2x. On B2B SaaS the ChatGPT figure rises to 3.2% versus 1.7% for Google organic, a 1.9x lift. On ecommerce ChatGPT converts at 1.7% versus Google organic 2.1%, so Google leads. ChatGPT is not the highest-converting AI engine in the cohort — Claude (3.4% blended) and Perplexity (3.1% blended) both convert higher per session — but ChatGPT carries 71% of AI session volume, so it drives the most absolute conversions.
Which AI engine has the highest conversion rate?
Claude has the highest blended conversion rate in the cohort at 3.4%, followed by Perplexity at 3.1%, ChatGPT at 2.5%, Gemini at 1.4%, and AI Overviews at 1.1%. On B2B SaaS specifically Claude leads even more clearly at 4.7%. The ranking tracks intent concentration: Claude and Perplexity users skew toward deliberate research, while Gemini and AI Overviews capture more incidental in-SERP exposure that does not pre-qualify the visitor. The ranking should be read with a volume caveat — Claude's small session base widens its confidence interval, so treat the Claude number as directional on any single site.
How wide is the variance on AI conversion rates between sites?
Very wide, and wider than for high-volume channels. The cohort interquartile range for blended AI conversion is 1.1% (p25) to 4.0% (p75) — a 3.6x spread between the 25th and 75th percentile site. The driver is sample size: most SMB sites get a few hundred to a few thousand AI sessions per month, which is enough to estimate a conversion rate but not enough to estimate it tightly. A site reading 5% AI conversion on 200 sessions has a 95% confidence interval roughly spanning 2.5% to 8.5%. The practical rule: do not trust a single-engine AI conversion rate below about 1,000 monthly sessions for that engine.
Does AI traffic convert better than paid ads?
On a per-session conversion basis, yes, in the cohort: blended AI converts at 2.3% versus 1.9% for paid search and roughly 0.6% for paid social on the same sites. The gap is sharper on B2B SaaS. The caveat is volume and control — paid channels deliver predictable, scalable volume you can buy on demand, whereas AI traffic arrives as a function of your citation share, which you influence but cannot purchase directly. The honest framing is that AI is a higher-intent but lower-control channel; it complements paid acquisition rather than replacing it.
What is the AI conversion rate by funnel stage?
Measured as session-to-Stripe-payment, the cohort shows AI traffic landing on a pricing or checkout page converting at 8.1%, a feature or comparison page at 4.7%, a deep blog page with an inline CTA at 3.2%, a deep blog page with no inline CTA at 0.9%, and the homepage at 2.3%. The 3.5x gap between deep blog pages with and without an inline CTA is the single largest actionable conversion lever in the dataset, because AI traffic lands on deep blog pages by default — 64% of blended AI sessions, 71% for ChatGPT.
How does AI conversion rate differ by device?
Desktop AI traffic converts roughly 1.6x better than mobile AI traffic in the cohort: a blended 2.9% on desktop versus 1.8% on mobile. The gap is wider than the device gap for Google organic (1.2x) because AI research sessions — especially ChatGPT and Claude workday queries — concentrate on desktop, where the buyer is in a work context and closer to a purchase decision. Mobile AI traffic skews toward casual evening research that converts later or not at all in the same session. For checkout-heavy ecommerce the device gap narrows because mobile checkout is well optimized.
What is the conversion rate for branded versus non-branded AI queries?
When the AI answer was responding to a branded query (the user named your product), the downstream session converts at a cohort median of 6.4%. When the answer responded to a non-branded category query ("best X for Y"), the session converts at 2.0%. Branded AI queries behave like branded search: the user already wants you and is using the AI to confirm or locate. Non-branded queries are top-of-category discovery and convert lower but represent net-new demand. We infer branded-vs-non-branded from landing-page intent and post-purchase survey on the subset where we can ask; treat the split as directional, not exact.
How is the Attrifast AI conversion benchmark measured, and what are its limits?
Conversion is defined as a first-party session that joins to a successful, non-refunded, non-test Stripe payment via session-ID metadata written at checkout. The dataset is 200 Stripe-connected SMB sites, rolling 30 days ending 2026-05-15, roughly 41.2M sessions and 168k payment events. Five limits matter: the sample self-selected into Attrifast (likely inflating AI share), skews bootstrapped SMB and US/EU, excludes non-Stripe billing, leans on an ~80%-precision behavioral layer to recover no-referer AI traffic, and reports a single non-seasonal 30-day slice. Single-engine conversion rates on low-volume engines (Claude, AI Overviews) carry wide confidence intervals and should be read as directional.
Should I optimize my whole site for AI conversion or just specific pages?
Specific pages. AI traffic concentrates on deep content pages, so the highest-leverage work is on the 10 to 30 blog and comparison pages that earn the most AI citations, not a site-wide redesign. The mechanical wins are an inline CTA on every cited deep page (a 3.5x lever in our data), inline pricing context so a cold visitor can self-qualify, and a sticky CTA that survives a long scroll. Reserve homepage and pricing-page optimization for the branded-query AI traffic, which already converts at 6.4% and needs less help.
Will AI conversion rates stay this high as adoption broadens?
Probably not at the current premium. The intent-quality advantage that makes AI traffic convert above Google organic on B2B SaaS comes partly from today's AI user base skewing toward deliberate, technical, research-mode users. As the base broadens toward general-consumer behavior, the premium will likely compress — the same way early-adopter cohorts on any channel convert above the eventual mainstream cohort. The conversion-rate gap is real today and worth acting on, but treat it as a 2026 snapshot to re-measure quarterly, not a structural constant.
Can I compare these AI conversion numbers to Unbounce or WordStream benchmarks?
Carefully, because the denominators differ. Unbounce's landing-page conversion benchmark and WordStream's account-level benchmarks measure conversion on paid landing pages with a form-fill or lead as the conversion event, not a Stripe payment. Our number is a harder conversion (actual money) on organic-style AI traffic. The cleanest cross-read is directional: WordStream's cross-industry median paid conversion sits around 7% on lead events, Unbounce reports a median near 4.3% across industries, and our AI-to-payment median of 2.3% is lower precisely because a payment is a stricter event than a lead. Match the conversion definition before comparing the numbers.
How do I increase my AI traffic conversion rate fastest?
Add an inline CTA to your most-cited deep pages. In the cohort, deep blog pages with an inline CTA convert AI traffic at 3.2% versus 0.9% without one — a 3.5x lift on the same page type. Since 64% of AI traffic lands on deep pages, and roughly half of those pages lack an inline CTA at a typical SMB, this single change recovers more AI conversion than any engine-level or device-level optimization. It is two hours of editorial work for a typical 30-post blog and dominates every other lever in the data.
Is AI Overviews traffic worth optimizing for conversion?
At the margin, less than the chat engines. AI Overviews traffic converts at the bottom of the AI ranking (1.1% blended) because much of it is incidental in-SERP exposure rather than deliberate research, and it lands shallower than chat-engine traffic. It is real and growing, but per-session it is the lowest-converting AI surface in the cohort. Prioritize ChatGPT, Perplexity, and Claude conversion architecture first; treat AI Overviews as a volume play whose conversion will improve mainly through the same deep-page inline-CTA work that helps every engine.
Related reading from the Attrifast research stack
To dive deeper, explore UTM to revenue tracking.
References
- Reuters — OpenAI ChatGPT weekly active users coverage, 2025–2026
- The Verge — ChatGPT daily message volume coverage, December 2024
- TechCrunch — Perplexity received 780 million queries last month, CEO says, 2025
- Search Engine Land — Google AI Overviews tracker
- Backlinko — AI Overviews and ChatGPT statistics
- Cloudflare Radar — AI insights
- SimilarWeb — AI Search Stats 2026: market share, referral, and citation data
- StatCounter — Search engine market share
- Unbounce — Conversion Benchmark Report
- WordStream — Conversion rate benchmarks
- Ruler Analytics — Conversion rate by industry
- OpenView — SaaS benchmarks report
- Littledata — Average ecommerce conversion rate (Shopify)
- HubSpot — Marketing statistics and benchmarks
- eMarketer — AI search forecast
- Adobe Analytics — Traffic to U.S. retail websites from generative AI sources jumps 1,200 percent. March 2025
- Profound — AI visibility platform
- BrightEdge — One Year Into Google AI Overviews: Google Search Usage Increases by 49%
- Semrush — AI search traffic research
- Stripe — Webhook delivery and idempotency
- Stripe — Checkout Session metadata field
- Google Analytics — GA4 default channel grouping
- Pew Research — Americans' use of AI tools
- ChartMogul — SaaS marketing attribution
For the revenue-per-visitor companion to these conversion numbers, see the 2026 AI Search Revenue Benchmark. For why AI traffic hides in GA4's Direct bucket and how to recover it before you can measure its conversion rate, see the ChatGPT referral analytics guide. For the per-engine detection playbooks, see track-chatgpt-traffic, track-perplexity-traffic, track-claude-traffic, and track-gemini-traffic. For the strategic AEO-vs-SEO budget split, see AEO vs SEO in 2026. To size your own AI conversion opportunity in dollars, use the marketing ROI calculator and the revenue attribution feature. If you want to see your own site's AI conversion split joined to Stripe, start the free trial — $9.99/mo, cookieless, no consent banner under most jurisdictions.