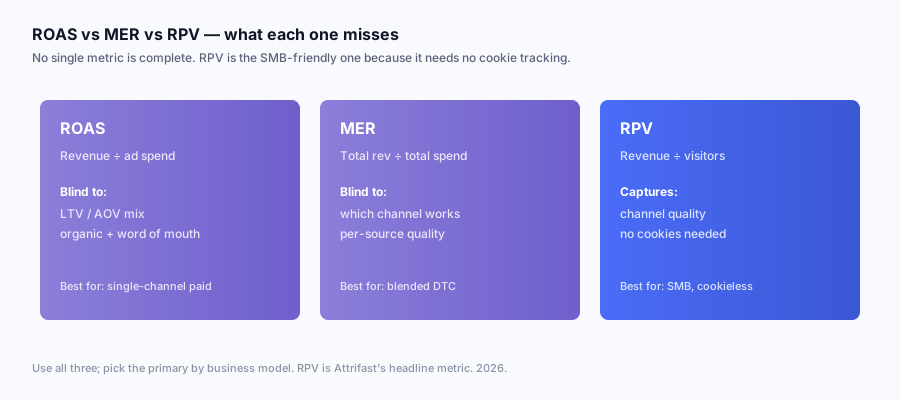
The "ROAS is dead" headline has been recycled every twelve months since iOS 14.5 shipped in April 2021. It is wrong in the same way "SEO is dead" is wrong: a metric loses its monopoly, not its utility. The actual 2026 picture is that ROAS, MER, and RPV measure three different things, and the SMB operator who watches only one of them is making decisions on a partial picture. Most of the public debate has been a two-metric debate between ROAS and MER, because the DTC ecosystem (Common Thread Collective, TripleWhale, Northbeam, Aaron Orendorff) owns the cultural conversation [2, 3, 4, 11]. The third metric, RPV, is structurally under-served because the cookieless session-to-Stripe join most attribution tools cannot ship is exactly the data primitive RPV needs.
This piece is the strategic-decision article: what each metric measures precisely, where it breaks, what the others fix, and how to pick a primary based on your business model. Four worked examples with full P&L mechanics: a DTC apparel store at $500k GMV, a bootstrapped SaaS at $20k MRR, a services business at $300k revenue, a solo content creator at $60k revenue. Each example shows how the same channel mix produces three different "winners" depending on which metric you optimize.
Quick Facts
| Spec | Value |
|---|---|
| iOS ATT opt-out rate (worldwide, 2024-2025) | Roughly 74-80%, per Adjust and Flurry [1] |
| Reported share of Meta conversions now modeled, not measured | Roughly 20-40% on iOS traffic, per Meta documentation [6] |
| Median DTC blended MER (2024 benchmark, post-iOS) | 3.2x, per Common Thread Collective [2] |
| Median DTC RPV (apparel and accessories, 2024) | $2.50, per Littledata [13] |
| Median SaaS marketing-site RPV | $0.80, per OpenView SaaS benchmarks [9] |
| ROAS target floor for paid social, contribution-margin positive | Typically 2.0-2.5x [3] |
| Third-party cookie deprecation in Chrome (status, Q2 2026) | Phased opt-in, default still on but eroding via Privacy Sandbox [12] |
| Default GA4 attribution model (2024+) | Data-driven attribution, cross-channel [16] |
| Multi-channel journey share of DTC conversions | Roughly 60-70%, per Adobe Digital Insights [14] |
| US digital ad spend trend (retail media share rising) | Double-digit annual growth, per eMarketer [30] |
| Median SMB attribution-tool spend (2024 survey) | $200-$800 per month, per HubSpot CRM benchmarks [10] |
The 74-80% iOS opt-out number is the load-bearing one. It is why Meta's reported ROAS for iOS traffic is a modeled estimate for the majority of conversions in 2026, not a measured number. The MER refactor of the DTC measurement stack happened because that estimate was no longer trustworthy enough to bid against. RPV is the third leg because it does not need the deterministic per-conversion attribution at all; it needs first-party session counts and Stripe revenue.
The three metrics, defined precisely
The single biggest source of confusion in the ROAS-vs-MER-vs-RPV debate is that the same operator will use the same word with three different denominators across the week and not notice. Lock the formulas down first.
ROAS (Return on Ad Spend)
| Field | Value |
|---|---|
| Formula | Revenue attributable to a specific ad / spend on that ad |
| Unit | Dimensionless ratio (e.g., "3.5x") or percentage (350%) |
| Denominator | Per-channel or per-campaign ad spend |
| Numerator | Per-channel or per-campaign revenue, requires attribution |
| Native to | Google Ads, Meta Ads Manager, TikTok Ads Manager [7, 8] |
| Sensitivity to attribution model | High; last-click vs data-driven can differ by 2-3x |
| Survives cookie loss | Poorly; the per-channel attribution is the broken piece |
| Best for | Single-campaign optimization where you control the click |
ROAS is the oldest of the three and the one with the most native tool support. Google Ads ships a "Conversion value / cost" column [7] and a target-ROAS Smart Bidding strategy built directly on it [22]; Meta ships "Purchase ROAS" [8]; every paid-search and paid-social platform has a variant. The math has not changed since the early 2010s. What changed is the trust you can place in the numerator.
MER (Marketing Efficiency Ratio)
| Field | Value |
|---|---|
| Formula | Total revenue / total marketing spend |
| Unit | Dimensionless ratio (e.g., "3.2x") |
| Denominator | All marketing spend (paid media, agency fees, tooling, sometimes salaries) |
| Numerator | All revenue, no per-channel attribution required |
| Native to | None; calculated in a spreadsheet or via TripleWhale / Northbeam dashboards [4, 5] |
| Sensitivity to attribution model | Zero; it is a sum |
| Survives cookie loss | Fully; does not require channel-level attribution |
| Best for | Business-level health check, CFO conversations |
MER (sometimes called blended ROAS, aMER for acquisition-only, eMER for efficiency-only) was popularized post-iOS by Common Thread Collective's Taylor Holiday and the TripleWhale ecosystem as the response to broken per-channel attribution [2, 4]. The number is harder to game because it sums all numerators and all denominators. The cost is that MER averages channel quality together: a healthy MER can hide one bleeding channel and one outperforming channel.
RPV (Revenue Per Visitor)
| Field | Value |
|---|---|
| Formula | Revenue / unique visitors (or revenue / sessions, depending on convention) |
| Unit | Currency (e.g., "$2.50 RPV") |
| Denominator | Visitors or sessions, total or per-channel |
| Numerator | Revenue, total or per-channel |
| Native to | Some ecommerce analytics suites (Shopify, Littledata); rarely calculated in B2B [13] |
| Sensitivity to attribution model | Low for site-wide; moderate for per-channel (visitor-to-channel assignment) |
| Survives cookie loss | Fully; only requires session counts and revenue, not deterministic ad-to-sale joins |
| Best for | Channel-quality comparison across paid and organic, content-heavy operators |
RPV is the metric the DTC conversation skips over because the cookieless first-party session count + revenue join is harder to ship than a spend / revenue ratio. Shopify's own analytics expose per-source sessions and conversion value, which is the raw material for RPV even though the platform never labels the ratio as such [21]. It is also the only one of the three that can compare a $0-spend organic channel to a $5k/month paid channel on the same axis. RPV does not care about cost; it cares about whether the traffic converts.
Side-by-side, the same number wears three faces
| Dimension | ROAS | MER | RPV |
|---|---|---|---|
| Denominator | Per-channel spend | Total spend | Visitors |
| Numerator | Per-channel revenue | Total revenue | Revenue (total or per-channel) |
| Attribution dependency | High | None | Low (none for site-wide) |
| Useful for paid channel? | Yes | Indirectly | Yes |
| Useful for organic channel? | No (no spend) | Indirectly | Yes |
| Useful for content / SEO? | No | Indirectly | Yes |
| Hides bad channels? | No (per-channel) | Yes | No (per-channel) |
| Hides bad campaigns? | Sometimes | Yes | Sometimes |
| Native tool support | High | Low | Very low |
| Survives iOS 14.5 ATT? | Poorly | Yes | Yes |
| Survives ITP / cookie loss? | Poorly | Yes | Yes |
The shape of the table tells the story. ROAS has the deepest tool support and the worst measurement survival. MER survives measurement loss but loses channel resolution. RPV survives measurement loss and keeps channel resolution, but you have to build the data layer because nobody ships it. That last row is not an opinion: across the 12 conversion tracking software products we tested on accuracy and setup, only two recorded revenue without cookies, which is the exact capability the RPV column depends on.
Where ROAS originated and why it broke
The ROAS metric is the direct descendant of direct-response advertising's "advertising-to-sales ratio," and the Google AdWords team baked it into the platform in the mid-2000s as "conversion value / cost" [7]. The metric assumes three things, and all three have eroded.
Assumption one: a deterministic ad-to-sale join. Click ID in the URL, conversion pixel on the thank-you page, server confirms the sale, ad platform attributes the revenue. The classic Google Ads gclid and Meta fbclid model. This worked when third-party cookies tracked users across sessions and when iOS Safari did not strip query parameters. ITP 2.3 in 2019 capped client-side cookies set by JavaScript at 7 days [15]. iOS 14.5 in April 2021 introduced ATT and pushed roughly 74-80% of iOS users to opt out of cross-app tracking, gutting Meta's deterministic conversion signal on iOS [1]. Chrome's Privacy Sandbox rollout has been slower but is steadily reducing third-party cookie reliability [12]. Net result: the deterministic join is a modeled estimate for 20-40% of Meta iOS conversions [6], a smaller but meaningful share of Google conversions, and a growing share everywhere else.
Assumption two: stable AOV per campaign. ROAS treats every dollar of revenue as fungible, which assumes the average order value (AOV) is stable. In a single-SKU store with one price point, this holds. In a multi-SKU store with $20 socks and $300 jackets and bundle SKUs and subscriptions, it breaks. A campaign that drives 100 sock orders looks the same as a campaign that drives 7 jacket orders on a ROAS basis if total revenue matches. The marginal-economics question (which orders are more profitable?) is invisible to ROAS.
Assumption three: the channel that captured the click is the channel that earned the sale. The 2010s last-click default attribution made this assumption automatic. Modern buyer journeys involve 5-15 touchpoints across 2-4 channels [14]. Last-click ROAS over-credits the closing channel (usually branded search or email) and under-credits the discovery channels (paid social, content, podcast). Data-driven attribution in GA4 since 2024 redistributes credit, but only across channels GA4 actually sees, which excludes most AI referrals and most cross-device journeys [16].
ROAS still works cleanly in one configuration: single-channel direct-response with a deterministic conversion path. Shopify store, Google Shopping ad, single SKU, gclid round-trip, conversion fires within 7 days. In that configuration, ROAS is the right primary metric. The configuration is rarer in 2026 than it was in 2018.
| ROAS-friendly business profile | ROAS-hostile business profile |
|---|---|
| Single-channel paid (Google Shopping only) | Multi-channel paid + organic mix |
| Single SKU or narrow SKU range | Wide SKU range, bundles, subscriptions |
| Direct-response intent (search) | Discovery intent (social, video) |
| Deterministic click-to-conversion (gclid) | Modeled conversions (Meta CAPI, GA4 modeled) |
| Conversion within 7 days of click | Long consideration cycle |
| Stable AOV | High AOV variance |
| Most revenue from same-channel click | Significant cross-channel attribution |
The MER refactor: what it fixes and what it doesn't
The MER concept is old. The Direct Marketing Association tracked "advertising-to-sales ratio" for decades [11]. The 2021 popularization is what is new. Common Thread Collective's Taylor Holiday, Aaron Orendorff's writing, and the TripleWhale product all started pushing MER as the post-iOS metric in 2021-2022 [2, 3, 4]. Trade press documented the broader DTC scramble to rebuild measurement after iOS 14.5 made per-channel attribution untrustworthy [29]. The pitch was correct: you cannot trust Meta's reported ROAS, so look at total revenue / total spend and ignore the noise.
What MER fixes
| Problem with ROAS | MER's fix |
|---|---|
| Per-channel attribution is unreliable post-iOS | MER is attribution-free; sums total revenue and total spend |
| LTV blind spot (ROAS measures first-order revenue only) | MER can be calculated on a 30/60/90-day window including repeat purchases |
| Channel double-counting (Meta and Google both claim the same sale) | MER cannot double-count because there is no per-channel denominator |
| CFO-incomprehensible (per-channel ROAS noise) | MER is one number anyone can audit against the bank statement |
| Optimization for cheap conversions instead of profitable ones | MER rewards revenue density per marketing dollar, not click cheapness |
What MER does not fix
| Problem MER inherits or creates | Why it matters |
|---|---|
| Channel-quality blind | A 3.2x MER with one channel at 8x and another at 1.2x looks identical to 3.2x at 3x across all channels |
| Cannot guide channel reallocation | If you cannot see per-channel performance, you cannot rebalance |
| Insensitive to incrementality | Adding $10k of brand spend that does nothing still shows up as flat MER if total revenue is flat |
| Mixes acquisition and retention spend | Hard to tell whether new customer growth or repeat purchase growth moved the number |
| Hides timing lag | Revenue this month, spend last month creates phantom MER moves on calendar boundaries |
The MER playbook addresses the second category with derivative metrics: aMER (acquisition-only MER, new-customer revenue / acquisition-channel spend), eMER (excluding retention spend), 30-day MER vs 90-day MER for LTV-weighted views [2][28]. TripleWhale's new-customer-acquisition-cost (nCAC) framing pairs with aMER to separate the growth question from the blended-efficiency question [27]. The decomposition helps. It also reintroduces complexity that the original "one number for the CFO" pitch was supposed to eliminate.
MER's true primary use case
MER is the right primary metric when (a) you have meaningful multi-channel paid spend, (b) per-channel attribution is degraded, and (c) the business question is "is our marketing motion working" not "which channel should we cut." For the latter question, MER is structurally the wrong tool, regardless of how cleanly it survives iOS ATT.
Why RPV is the SMB-friendly answer
RPV is the metric the bootstrapped SaaS operator and the content-heavy DTC store have been quietly using for years without naming it. Shopify ships per-source revenue and per-source sessions; the ratio is RPV [13]. Google Analytics ships sessions and conversions by source; the dollar-weighted version is RPV. Nobody packaged it because the per-channel revenue side needed a Stripe join most analytics tools did not own, and the per-channel visitor side needed cookieless session tracking that ITP and ATT were quietly breaking.
What RPV measures
RPV asks a different question than ROAS or MER. ROAS asks "is this ad profitable?" MER asks "is the whole marketing motion profitable?" RPV asks "how well does this traffic source convert?" The metric is denominated in dollars per visitor, which makes the answer comparable across channels regardless of whether you paid for the traffic or not.
| Channel | Visitors | Revenue | RPV | ROAS | MER contribution |
|---|---|---|---|---|---|
| Google Ads | 8,000 | $32,000 | $4.00 | 3.2x ($10k spend) | Adds $32k to numerator |
| Meta Ads | 12,000 | $24,000 | $2.00 | 2.0x ($12k spend) | Adds $24k to numerator |
| Organic search | 18,000 | $36,000 | $2.00 | N/A | Adds $36k to numerator |
| 4,000 | $20,000 | $5.00 | N/A | Adds $20k to numerator | |
| Direct | 6,000 | $18,000 | $3.00 | N/A | Adds $18k to numerator |
| Referral | 2,000 | $10,000 | $5.00 | N/A | Adds $10k to numerator |
Read the table by RPV. Email and Referral are the highest-RPV channels at $5.00. Google Ads is next at $4.00. Direct is $3.00. Meta Ads and Organic search both sit at $2.00. The ROAS chart would have you focus on Google (3.2x) over Meta (2.0x). The MER chart would tell you the whole motion is healthy ($140k revenue on $22k paid spend = 6.4x). The RPV chart tells you something neither of those tells: your highest-quality traffic is Email and Referral, and your paid channels deliver mediocre per-visitor monetization compared to the organic and earned channels.
That is not a ROAS vs MER vs RPV "winner" question. It is three different lenses on the same data, and any operator looking at only ROAS would never know that Email is a 2.5x better revenue-per-visitor channel than their Meta spend.
Why RPV survives the measurement breakage
| Measurement break | ROAS impact | MER impact | RPV impact |
|---|---|---|---|
| iOS 14.5 ATT opt-out | Severe; modeled conversions | None | None for site-wide; minor for per-channel (referer loss) |
| ITP 2.3 cookie lifetime cap | Moderate; 7-day window shrinks attribution | None | None; first-party session tracking unaffected |
| Chrome third-party cookie deprecation | Severe over time | None | None; first-party only |
| GDPR consent banner non-acceptance | Severe; cookies blocked | None | None for cookieless trackers; moderate for cookie-based |
| Cross-device journey | Moderate; identity stitching breaks | None | Moderate; same person counted as two visitors |
| Multi-touch journey | Severe; last-click misattributes | None | None for site-wide; moderate for per-channel |
The pattern: ROAS is the most damaged metric in 2026's measurement environment, MER survives by being attribution-free, and RPV survives by needing only what cookieless first-party analytics can deliver. The cost of RPV is that you need a tool that joins first-party sessions to your revenue source (Stripe, Shopify, your billing system) without depending on third-party cookies. That join is the hard part. It is what Attrifast was built to do.
Worked example 1: DTC apparel store at $500k GMV
The first business is the canonical ROAS-vs-MER conversation: a Shopify DTC apparel store at $500k annual GMV, 60% paid traffic, 40% organic / email / referral. Numbers are illustrative but reflect the ranges Common Thread Collective and Littledata report for the segment [2, 13].
Setup
| Field | Value |
|---|---|
| Annual GMV | $500,000 |
| AOV | $85 |
| Total orders | 5,882 |
| Gross margin | 55% |
| Annual marketing spend | $150,000 |
| Blended MER | 3.33x |
| Contribution margin after marketing | $125,000 (25%) |
Channel breakdown
| Channel | Visitors | Revenue | Spend | ROAS | RPV | CPV |
|---|---|---|---|---|---|---|
| Google Ads | 80,000 | $160,000 | $50,000 | 3.2x | $2.00 | $0.63 |
| Meta Ads | 200,000 | $140,000 | $80,000 | 1.75x | $0.70 | $0.40 |
| TikTok Ads | 100,000 | $30,000 | $20,000 | 1.5x | $0.30 | $0.20 |
| Organic search | 60,000 | $80,000 | $0 | N/A | $1.33 | $0.00 |
| 25,000 | $60,000 | $0 (in spend) | N/A | $2.40 | $0.00 | |
| Direct / Referral | 35,000 | $30,000 | $0 | N/A | $0.86 | $0.00 |
| Total | 500,000 | $500,000 | $150,000 | 3.33x (MER) | $1.00 (site-wide) | $0.30 (paid CPV) |
What each metric says to cut or scale
| Metric | Top channel | Channel to cut | What the metric tells you |
|---|---|---|---|
| ROAS | Google Ads (3.2x) | TikTok (1.5x, near break-even) | Optimize bidding; reallocate from TikTok to Google |
| MER (3.33x) | N/A (blended) | N/A (target healthy) | Whole motion is fine; total spend efficiency is on target |
| RPV | Email ($2.40) | TikTok ($0.30) | Traffic quality ranks: Email > Google > Organic > Direct > Meta > TikTok |
The ROAS lens says cut TikTok because it is barely above contribution-margin break-even. The RPV lens agrees but for a different reason: TikTok visitors monetize at one-eighth the rate of Email visitors. The MER lens says the business is healthy and does not surface either signal.
Now the interesting wrinkle. Apply iOS 14.5 modeling adjustments. Meta's reported ROAS is roughly 1.75x in the table, but Meta is modeling 30% of those conversions [6]. A common audit pattern: the modeled conversions over-attribute view-through credit. The "real" measured Meta ROAS, cross-checked against Stripe revenue with first-party visitor join, often comes in 20-40% lower than the platform-reported number [2]. If real Meta ROAS is 1.2x rather than 1.75x, you are losing money on every Meta dollar after contribution margin. ROAS-as-reported is hiding the bleed. MER absorbs the bleed into the blended number. RPV tells you Meta visitors monetize at $0.70, which is 25% below the paid-channel benchmark and worth investigating.
What this business should do
The 80% case: keep MER as the CFO-facing number, use per-channel RPV as the channel scorecard, use ROAS to bid within each paid channel. Reallocate budget from TikTok and Meta into Google, invest in Email infrastructure (since it is the highest-RPV channel and has zero spend), and treat Organic search as a growth lever worth funding via SEO and content investment.
Worked example 2: Bootstrapped SaaS at $20k MRR
The second business is a bootstrapped B2B SaaS at $20k MRR, ~$240k ARR, 700 paid customers at $28/month average ACV. Mostly organic and content-driven, with experimental paid spend. This is the profile Attrifast itself fits, and the profile where RPV becomes the only honest primary metric.
Setup
| Field | Value |
|---|---|
| MRR | $20,000 |
| ARR | $240,000 |
| Customers | 700 |
| ACV / month | $28.57 |
| LTV (24-month average) | $480 |
| Annual marketing spend | $36,000 ($3k/month) |
| Blended MER (annualized) | 6.67x |
| New customers / month | 35 |
Channel breakdown (monthly)
| Channel | Visitors | Signups | Paid conversions | Revenue (LTV) | Spend | ROAS (LTV) | RPV (LTV) | CPV |
|---|---|---|---|---|---|---|---|---|
| Organic search (SEO blog) | 12,000 | 240 | 18 | $8,640 | $0 | N/A | $0.72 | $0.00 |
| Google Ads | 1,500 | 60 | 6 | $2,880 | $1,500 | 1.92x | $1.92 | $1.00 |
| LinkedIn Ads | 800 | 24 | 3 | $1,440 | $1,200 | 1.20x | $1.80 | $1.50 |
| Direct / Branded | 2,500 | 50 | 5 | $2,400 | $0 | N/A | $0.96 | $0.00 |
| Referral / Partner | 1,200 | 36 | 3 | $1,440 | $300 | 4.80x | $1.20 | $0.25 |
| AI referrals (ChatGPT, Perplexity) | 800 | 20 | 0 | $0 | $0 | N/A | $0.00 | $0.00 |
| Total | 18,800 | 430 | 35 | $16,800 | $3,000 | 5.60x (MER) | $0.89 (site-wide) | $0.45 (paid CPV) |
A few observations. Organic search is the volume engine (64% of all visitors). The two paid channels combined drive 9 of 35 new customers and 25% of new revenue at a 1.5x weighted paid ROAS. AI referrals show 800 visitors and zero paid conversions, which is either a real conversion lag (AI traffic is top of funnel for SaaS) or a measurement artifact (the AI-to-Stripe join is hardest to close because GA4 buckets AI as Direct [16] and most SaaS attribution stops at signup). The Direct / Branded channel is meaningful but likely double-counts traffic that started in Organic or AI and returned later.
What each metric says
| Metric | Reading | Decision implication |
|---|---|---|
| ROAS (paid only) | 1.92x Google, 1.20x LinkedIn, 4.80x Referral | Cut LinkedIn, scale Referral, hold Google |
| MER | 5.60x | Healthy; SaaS MER target is 2-4x for venture-funded, 4-8x for bootstrapped |
| RPV (per-channel) | Google $1.92, LinkedIn $1.80, Referral $1.20, Organic $0.72, Direct $0.96, AI $0.00 | Paid channels have higher RPV than organic; volume drives organic revenue contribution |
The MER and ROAS lenses both push toward "scale paid." The RPV lens reveals the nuance: per-visitor, paid is more efficient, but the volume gap means Organic still contributes 51% of revenue. Killing the SEO investment to chase higher-RPV paid would shrink the funnel even though the per-visitor math looks better. This is exactly the case where the operator using a single metric makes the wrong call.
For a bootstrapped SaaS, RPV is the right primary metric for three reasons. First, the operator cannot trust per-channel paid attribution at small spend levels (Google's conversion modeling is noisier under $5k/month; Meta's CAPI signal is sparse). Second, organic and referral are the dominant traffic sources, and ROAS literally cannot compare them. Third, the LTV multiplier on SaaS revenue (24-36 months) means that the question "did this visitor become a paying customer?" matters more than "did this campaign hit a 3x ROAS in the first month?" RPV captures the conversion question; ROAS captures the bidding question.
Worked example 3: Services business at $300k revenue
The third business is a consulting / agency / professional services firm at $300k annual revenue, 12 clients at ~$25k average annual contract, sales-led with a marketing site that drives roughly 60% of new pipeline. Marketing spend is heavy on content, LinkedIn, and conference sponsorships. ROAS is the wrong metric structurally because the conversion event is a sales call, not a checkout.
Setup
| Field | Value |
|---|---|
| Annual revenue | $300,000 |
| Clients | 12 |
| Average annual contract | $25,000 |
| New clients per year | 6 |
| Annual marketing spend | $40,000 |
| Blended MER (annualized) | 7.5x |
| Sales cycle | 60-90 days |
Channel breakdown (annual)
| Channel | Visitors | Discovery calls | New clients | Revenue (annual contract) | Spend | RPV |
|---|---|---|---|---|---|---|
| Organic search | 8,000 | 24 | 3 | $75,000 | $0 | $9.38 |
| LinkedIn organic + ads | 3,000 | 18 | 2 | $50,000 | $15,000 | $16.67 |
| Conference / referral | 500 | 12 | 1 | $25,000 | $20,000 | $50.00 |
| Email / newsletter | 1,500 | 6 | 0 | $0 (long lag) | $5,000 | $0.00 |
| Direct / Branded | 800 | 4 | 0 | $0 (long lag) | $0 | $0.00 |
| Total | 13,800 | 64 | 6 | $150,000 (acquisition-only) | $40,000 | $10.87 (site-wide) |
Note the table tracks acquisition revenue only; the remaining $150k of the $300k comes from existing clients renewing or expanding, which is not a marketing-attributed line.
What each metric says
| Metric | Reading | Limitation |
|---|---|---|
| ROAS | Cannot compute for LinkedIn ads cleanly because conversion is a call, not a checkout; would need ARR / spend assumption | ROAS misframes the question for services |
| MER (acquisition-only) | 3.75x ($150k / $40k); 7.5x if including renewal revenue | Honest at the business level; cannot guide channel decisions |
| RPV | Conference $50, LinkedIn $16.67, Organic $9.38, Email $0, Direct $0 | Captures channel quality cleanly; reveals Conference is highest-RPV despite low volume |
RPV is dramatically the most informative metric for a services business. The traffic counts are small enough that ROAS noise is unmanageable, and MER does not distinguish between paying for a high-RPV conference and paying for a low-RPV email tool. The RPV table tells the operator: invest more in conferences (highest RPV by 3x), keep LinkedIn (strong RPV), continue Organic SEO (lower RPV but zero cost and material contribution), and audit Email investment (zero attributed revenue suggests either misattribution or a real signal).
Services businesses tend to under-use RPV because the visitor-to-revenue ratio is so spiky (one $25k contract dwarfs hundreds of pageviews) that the metric looks unstable. Stable on rolling 6-12 month windows; unstable monthly. Set the cadence to the sales cycle, not the calendar.
Worked example 4: Solo content creator at $60k revenue
The fourth business is a solo content creator: newsletter, YouTube channel, occasional sponsorships, paid memberships, affiliate links. $60k annual revenue from 25,000 monthly newsletter subscribers and 80,000 monthly YouTube views. Marketing spend is near zero (occasional tools, hosting). ROAS is undefined for most of the business because there is no ad spend. MER is technically calculable but uninformative because the denominator is tiny. RPV is the entire game.
Setup
| Field | Value |
|---|---|
| Annual revenue | $60,000 |
| Newsletter subscribers | 25,000 |
| YouTube monthly views | 80,000 |
| Website monthly visitors | 35,000 |
| Annual marketing spend | $2,400 ($200/month: tools, hosting) |
| Blended MER (annualized) | 25x |
| Revenue mix | Sponsorships 40%, memberships 30%, affiliate 20%, courses 10% |
Channel breakdown (annual)
| Channel | Visitors | Revenue | RPV | Notes |
|---|---|---|---|---|
| YouTube embeds + referrals | 180,000 | $18,000 | $0.10 | Affiliate + sponsorship pull-through |
| Newsletter clicks | 120,000 | $24,000 | $0.20 | Memberships and course sales concentrate here |
| Organic search | 80,000 | $9,000 | $0.11 | Discovery; converts to newsletter |
| Social referrals (X, LinkedIn) | 30,000 | $4,500 | $0.15 | Discovery; converts to newsletter |
| Direct / Brand | 10,000 | $4,500 | $0.45 | Repeat readers, highest intent |
| Total | 420,000 | $60,000 | $0.143 (site-wide) |
What each metric says
| Metric | Reading | Decision implication |
|---|---|---|
| ROAS | Undefined for most channels | Not the right tool |
| MER | 25x on $2,400 spend | Trivially "healthy" because near-zero denominator |
| RPV | Newsletter $0.20, Direct $0.45, Social $0.15, YouTube $0.10, Organic $0.11 | Newsletter is the conversion engine; YouTube drives volume but not direct RPV (does drive subscribers, which become Newsletter RPV later) |
The creator's actual job, as RPV reveals, is to convert YouTube and Organic visitors into Newsletter subscribers, because newsletter visitors monetize at 2x the rate of YouTube visitors. The funnel is YouTube → Newsletter signup → Newsletter clicks → Memberships and sponsorships. ROAS cannot describe that funnel because there is no ad spend. MER cannot describe it because everything is a rounding error against zero spend. RPV maps it perfectly.
This is the structural reason RPV is under-served in the public marketing-metrics conversation: most of the people who would benefit from RPV (content creators, bootstrapped SaaS, services businesses, organic-heavy DTC) do not run paid programs at scale, so they are not in the TripleWhale / Northbeam customer base where the MER conversation lives. The DTC consultancies that own the discourse are pitching to operators with $50k+ monthly paid spend. RPV is the bootstrapped operator's metric, and the tooling gap is real.
The metric x attribution model interaction
ROAS, MER, and RPV interact with attribution models differently. The interaction table is the part of the metrics conversation that most blog posts skip and that materially changes which number you trust.
| Attribution model | ROAS impact | MER impact | RPV impact |
|---|---|---|---|
| Last-click | Over-credits closing channels (branded search, email); under-credits discovery (paid social, content) | None (sum) | Per-channel RPV inherits the same skew; site-wide RPV unaffected |
| First-click | Over-credits discovery; under-credits closing channels | None (sum) | Per-channel RPV inherits the same skew |
| Linear (equal credit) | Smooths channel credit; ROAS gaps narrow | None (sum) | Per-channel RPV smoothed |
| Time-decay | Modestly over-credits recent touches | None (sum) | Per-channel RPV slightly recency-weighted |
| Data-driven (GA4 default) | Most balanced; depends on conversion volume to train | None (sum) | Best per-channel RPV signal if GA4's training data is clean |
| Position-based (U-shaped) | Credits first and last touch heavily | None (sum) | Per-channel RPV credits discovery and closing channels |
| Custom multi-touch | Operator-defined | None (sum) | Operator-defined |
The pattern: MER is attribution-model-invariant because it has no per-channel denominator. ROAS is attribution-model-dependent in the worst way: the platform-reported ROAS in Google Ads or Meta Ads Manager uses each platform's own attribution model, which means the number you see in Google differs from the number you see in Meta differs from the number GA4 shows. Per-channel RPV is attribution-model-dependent but less so than ROAS because the visitor-to-channel assignment is usually simpler than the revenue-to-channel assignment (most analytics tools assign a visitor to the channel of their first session of the conversion window, which is more deterministic than weighted revenue credit).
Attrifast's default model is first-touch attribution by default with last-touch and linear as switchable views in the dashboard. The choice of first-touch as default reflects the bootstrapped-operator bias: discovery channels (SEO, content, AI referrals, podcasts) get under-credited by last-click in classic GA4, and first-touch corrects toward the channels that bootstrapped operators actually invest in [16].
Benchmarks: what good looks like by industry
Benchmarks are dangerous because they pool wildly different traffic mixes, business models, and attribution definitions. The ranges below are directional, drawn from Common Thread Collective, Littledata, OpenView, Adobe Digital Insights, eMarketer, and HubSpot through 2024-2025 [2, 9, 10, 13, 14], cross-checked against the conversion-rate and channel-performance benchmark sets published by Backlinko, Ahrefs, and Semrush [24, 25, 26]. Beat your own previous quarter, not these numbers.
ROAS benchmarks (per-channel, last-click reported)
| Industry | Google Ads ROAS | Meta Ads ROAS | TikTok Ads ROAS |
|---|---|---|---|
| DTC apparel | 3-5x | 1.5-3x | 1.2-2.5x |
| Beauty / skincare | 4-7x | 2-4x | 1.5-3x |
| Home goods | 3-5x | 1.5-3x | 1-2x |
| Subscription DTC | 2-4x (first order) | 1.2-2.5x | 1-2x |
| B2B SaaS | 1-3x (first month) | 0.5-2x | N/A |
| Services / agency | 2-5x (LTV-weighted) | 1-3x | N/A |
| Marketplace | 2-4x | 1-2.5x | 1-2x |
| Content / publisher | 1-2x (ad revenue) | 0.5-1.5x | 0.5-1.5x |
MER benchmarks (blended)
| Industry | Healthy MER | Target MER for growth | Warning threshold |
|---|---|---|---|
| DTC apparel | 3-5x | 4-6x | <2x |
| Beauty / skincare | 3-6x | 5-7x | <2.5x |
| Home goods | 3-5x | 4-6x | <2x |
| Subscription DTC | 2-4x (first order); 5-10x (LTV) | 4-6x LTV | <1.5x first order |
| B2B SaaS (bootstrapped) | 4-8x | 6-10x | <3x |
| B2B SaaS (venture) | 2-4x | 3-5x | <1.5x |
| Services / agency | 4-10x | 6-12x | <3x |
| Content / creator | 10-50x | 20x+ | <5x |
RPV benchmarks (site-wide)
| Industry | RPV range | Top quartile | Notes |
|---|---|---|---|
| DTC apparel | $1.50-$4.00 | $4.00+ | Per Littledata 2024 [13] |
| Beauty / skincare | $2.00-$6.00 | $6.00+ | Higher AOV than apparel |
| Home goods | $3.00-$8.00 | $8.00+ | Highest AOV in DTC |
| Subscription DTC | $1.00-$3.00 (first-order); higher on LTV | $3.00+ | First-order RPV understates value |
| B2B SaaS (marketing site) | $0.50-$3.00 | $3.00+ | Per OpenView benchmarks [9] |
| Services / agency | $5.00-$50.00 | $50.00+ | High variance; long sales cycle |
| Marketplace | $0.20-$1.50 | $1.50+ | Two-sided revenue split |
| Content / publisher | $0.05-$0.30 | $0.30+ | Ad-revenue and affiliate dominant |
| Newsletter / creator | $0.10-$0.50 | $0.50+ | Direct memberships and sponsorships |
A note on the SaaS benchmark: the $0.50-$3.00 range conflates marketing-site visitors (low RPV because most are top-of-funnel) with logged-in app visitors (excluded from marketing analytics). Use marketing-site RPV for channel comparison and ignore the rest.
Choosing your primary metric: a decision framework
The decision tree below assumes you watch all three metrics. The question is which one drives the weekly review and the quarterly plan.
The cheat sheet
| Business profile | Primary metric | Supporting metrics | Why |
|---|---|---|---|
| DTC, single-channel paid (Google Shopping only) | ROAS | MER, RPV | Deterministic conversions; ROAS is the cleanest signal |
| DTC, multi-channel paid (Google + Meta + TikTok) | MER | per-channel ROAS, per-channel RPV | Cross-platform ROAS not comparable; MER is the truth |
| DTC, mixed paid + organic | MER for health, RPV for allocation | Per-channel ROAS | Need both health and allocation signals |
| Bootstrapped SaaS | RPV | MER, per-channel ROAS for paid | Organic-heavy; ROAS cannot compare channels |
| Venture SaaS | MER + RPV | Per-channel ROAS, CAC payback | LTV math dominates; MER aligns with board, RPV with operators |
| Services / agency | RPV | MER | ROAS undefined; RPV captures channel quality |
| Content / creator | RPV | MER trivially | ROAS undefined; RPV is the whole game |
| Marketplace | RPV per side + MER | ROAS per side | Two-sided economics require per-side metrics |
Common metric mistakes
Six patterns I see repeatedly in audits of SMB marketing stacks. Most of them come from inheriting a metric definition from a previous role or a consultancy and not interrogating whether the math fits the current business.
Mistake one: comparing Meta-reported ROAS to Stripe revenue. Meta's ROAS is calculated using Meta's attribution window (default 7-day click + 1-day view as of 2024) and Meta's conversion modeling for iOS [6, 8, 23]. Stripe revenue is the cash truth. The gap between the two is not "Meta is lying"; it is "you are comparing two different things." Reconcile by pulling Meta's conversion list, joining to Stripe by customer email or order ID, and computing actual measured ROAS. Most operators find the measured number is 60-85% of the Meta-reported number on iOS-heavy traffic.
Mistake two: chasing low CPC instead of high RPV. A campaign with $0.20 CPC and $0.30 RPV is worse than a campaign with $2.00 CPC and $4.00 RPV. The first is 1.5x; the second is 2x. CPC is a vanity metric without an RPV pair. The Google Ads optimizer will happily drive your CPC down by serving cheaper traffic that does not convert. Watch RPV-CPV margin, not CPC.
Mistake three: treating MER as gospel. MER is the right CFO number. It is not the right operator number. A 3.5x MER can be made up of one 8x channel and one 1x channel, and you cannot tell from the MER. Always decompose MER by channel using either per-channel ROAS or per-channel RPV before making allocation decisions.
Mistake four: comparing per-channel RPV without normalizing for funnel stage. A blog post that ranks for "what is RPV" has a different RPV than a pricing page, because the funnel intent is different. Compare RPV within funnel stage (top-of-funnel pages against each other; pricing pages against each other; comparison pages against each other), not across.
Mistake five: not weighting RPV by LTV in SaaS. First-order RPV in DTC is fine because most DTC orders are one-off. First-month RPV in SaaS is misleading because the LTV multiplier is 12-36x. Calculate RPV on the LTV value of the converted customer, not the first-month subscription. The lift is dramatic and changes the channel ranking.
Mistake six: not closing the loop to actual revenue. All three metrics assume the revenue number is the cash number. If your revenue source is your ad platform's reported conversion value (Google's "conv value" column), you are double-counting and over-attributing. The revenue truth is your billing system: Stripe, Shopify, QuickBooks, your CRM. Every metric in this article should be computed on billed revenue, not platform-reported conversion value. The join is what most SMB attribution stacks lack and the gap Attrifast closes natively for Stripe.
Limitations
A few things this article does not cover.
- Incrementality testing. None of ROAS, MER, or RPV are incrementality metrics. They all measure observed performance, not the counterfactual "what would have happened without this channel." For incrementality you need geo-tests, holdouts, or media mix modeling. Northbeam and Haus run good primers here [5].
- Multi-product cart economics. The RPV examples in this article treat AOV as effectively stable. Real multi-product carts with bundles, subscriptions, and cross-sells require per-SKU RPV or contribution-margin-weighted RPV. The principle is the same; the math is more complex.
- Cross-device journey stitching. Identity resolution across mobile-to-desktop journeys breaks all three metrics. The user who clicked a Meta ad on phone and bought on desktop next morning gets fractured. The fix is first-party identity (logged-in users, email-based stitching), which not every business has.
- B2B with long sales cycles. Enterprise B2B with 6-18 month sales cycles needs a different metric stack entirely. ROAS and MER on a quarterly basis are noise; the right primary is pipeline-influenced revenue at the lead-to-opportunity boundary, not visitor-to-customer revenue.
- Currency and FX. Multi-currency businesses need to normalize revenue to a single reporting currency before computing any of these metrics. Daily FX moves can shift reported MER by 1-2% on volatile currencies.
FAQ
What is the difference between ROAS, MER, and RPV?
ROAS is per-channel revenue divided by per-channel ad spend, measuring single-ad efficiency. MER is total revenue divided by total marketing spend, ignoring per-channel attribution for a business-level efficiency number. RPV is total revenue divided by total visitors (or per-channel revenue divided by per-channel visitors), measuring traffic-source quality. ROAS answers "should I spend more on this ad?" MER answers "is my whole marketing motion working?" RPV answers "which channel sends the highest-quality traffic?" Most healthy SMB stacks watch all three and pick a primary based on business model.
Is ROAS still useful in 2026?
Yes, but its scope shrank. ROAS works cleanly when you can attribute conversions to ads with high confidence, your AOV is stable, and most of your revenue comes from the same channel where the click happened. iOS 14.5+ ATT, ITP 2.3, Chrome's cookie deprecation, and the Meta CAPI modeling layer have all eroded the attribution leg. Multi-product carts and subscription LTV erode the AOV leg. Cross-channel journeys erode the same-channel leg. ROAS is still the right primary metric for direct-response DTC with single-SKU buys and tight attribution windows. For everyone else, it should be a supporting metric next to MER and RPV.
What is a good RPV benchmark?
Directional ranges from Littledata, OpenView, and Adobe through 2024-2025: DTC apparel $1.50-$4.00, beauty $2.00-$6.00, home goods $3.00-$8.00, B2B SaaS marketing site $0.50-$3.00, content publisher $0.05-$0.30, marketplace $0.20-$1.50. The goal is not to beat the industry; it is to beat your own previous quarter and to compare RPV across your own channels. A channel with 2x your blended-site RPV is high-quality traffic regardless of cost.
Why did MER become popular?
MER became the default DTC metric after iOS 14.5 in 2021 made per-channel paid-social ROAS unreliable. Common Thread Collective, Aaron Orendorff, and the TripleWhale ecosystem pushed MER hard from 2021-2024 as the post-iOS metric that survived attribution loss. The pitch is correct: you cannot trust Meta's reported ROAS, so look at total revenue / total spend. MER's blind spot is that it averages channel quality together. You can hit a healthy MER target while burning cash on a bad channel.
When should I use RPV instead of ROAS?
Use RPV as your primary metric when you have meaningful organic / content / referral traffic where ROAS does not apply, when your attribution stack is degraded by cookie loss, when your unit economics depend more on conversion rate and AOV than on cost-per-click, or when you run a content-heavy SaaS or bootstrapped operator where most channels are unpaid. Pair RPV with cost-per-visitor (CPV) where spend exists to get an RPV-CPV margin that mirrors ROAS but works across all channels.
How does attribution model interact with these metrics?
ROAS is the most attribution-sensitive of the three. Last-click ROAS gives a different number than first-click, time-decay, or data-driven, sometimes by 2-3x on the same campaign. MER is the least attribution-sensitive because it sums everything. RPV sits in the middle: site-wide RPV is attribution-free, but per-channel RPV depends on visitor-to-channel assignment.
Can I use ROAS, MER, and RPV together?
Yes, and you should. MER as the business-level health check, per-channel RPV as the channel-quality scorecard, ROAS as the campaign-level signal for paid channels you actively bid. MER tells you whether the boat is floating. RPV tells you which oars are pulling. ROAS tells you which strokes to take on the oars you control.
How does Attrifast report these metrics?
Attrifast joins first-party cookieless session data to Stripe payment events and reports per-channel revenue, per-channel visitors, per-channel RPV out of the box. ROAS reports for channels where you import spend (Google Ads, Meta, TikTok, LinkedIn). MER reports at the dashboard level as total Stripe revenue / total imported ad spend. The RPV reporting is the part no other attribution tool ships natively because the cookieless session-to-Stripe join is the hard part. See Attrifast or try the marketing ROI calculator.
What if I have no paid spend at all?
RPV is your only metric. ROAS is undefined. MER is technically calculable (total revenue / total marketing spend including tools, content costs, freelancer fees) but the denominator is so small that the ratio is uninformative. Watch site-wide RPV trend over time, per-channel RPV to compare organic sources, and per-page RPV to identify your highest-converting content.
Does MER include CAC payback or LTV?
MER as classically defined is a revenue / spend ratio at the period level (monthly or quarterly). It does not directly express CAC payback or LTV, though you can decompose: aMER (acquisition-only MER) plus the LTV multiplier approximates CAC payback. The cleanest workflow is to compute MER for the period revenue, CAC payback separately as new-customer acquisition cost / first-year revenue, and LTV separately as 24-36 month revenue per cohort. Each answers a different question.
Why is RPV under-served by attribution tools?
The cookieless session-to-Stripe join is the hard part. ROAS requires only the platform-reported number. MER requires only the spreadsheet sum. RPV requires first-party session tracking that survives ITP and ATT, plus a deterministic join from those sessions to the Stripe customer at payment. Most attribution tools were built around the third-party cookie era and have not been retooled for cookieless. Product analytics tools miss it from the other direction — they count events beautifully and never see a Stripe dollar, which is why a category of Mixpanel alternatives for revenue tracking exists at all. Tools that ship per-source revenue typically use last-click attribution from GA4, which buckets a large share of modern traffic (AI referrals, ATP-stripped iOS traffic) into Direct, distorting per-channel RPV. The Stripe-native cookieless join is the differentiator, not the metric definition.
Should bootstrapped SaaS founders ignore ROAS entirely?
No, but de-prioritize it. ROAS still matters for the paid channels you actively bid (Google Ads campaigns, LinkedIn promoted posts, sponsored newsletters). Use it as the campaign-level signal within a channel: "is this campaign hitting my target ROAS?" Do not use it as a cross-channel comparison because the attribution noise is too high at SMB spend levels. Use RPV for cross-channel comparison. See customer acquisition cost by channel for the CAC-side of the same conversation if relevant.
What is the right LTV window to use in MER and RPV?
For DTC, 12-month LTV is the standard, with 6-month as the conservative cut. For SaaS, 24-month LTV is standard, with 12-month as the conservative and 36-month as the optimistic. Whatever window you pick, use it consistently across all three metrics. Mixing first-order RPV with 24-month LTV ROAS will make ROAS look 24x healthier than it is.
How often should I review each metric?
Weekly: per-channel ROAS for paid campaigns you actively bid (so you can pause underperformers fast). Monthly: MER (the business-level health number, calendar-aligned to your accounting close). Quarterly: per-channel RPV trend (slower-moving channel-quality signal, smooths out monthly noise). The mistake is reviewing MER weekly (too noisy) or RPV monthly (too jumpy for content channels).
What replaces these metrics if and when first-party identity stitching becomes universal?
Probably nothing for years. Even if first-party identity stitching becomes universal (cleanrooms, deterministic email-based identity across channels), ROAS, MER, and RPV will still describe three different questions: campaign efficiency, business-level efficiency, traffic quality. The mechanics of computing them get easier; the conceptual distinction does not collapse. The likeliest evolution is that MER and RPV become more reliable as the cookie noise drops, and ROAS regains some of its old confidence on the paid channels.
Related reading from the Attrifast research stack
For hands-on tools, see UTM to revenue tracking and Stripe revenue attribution.
References
- Adjust and Flurry: iOS App Tracking Transparency opt-out rates, 2021-2025. https://www.adjust.com/blog/ios-14-att-update/
- Common Thread Collective: MER, aMER, and the post-iOS attribution playbook. https://commonthreadco.com/blogs/coachs-corner
- Aaron Orendorff: DTC marketing essays and MER framing. https://aaronorendorff.com/
- Triple Whale: Pixel-less attribution and MER tooling. https://www.triplewhale.com/blog
- Northbeam: Multi-touch attribution and incrementality. https://www.northbeam.io/blog
- Meta for Business: iOS 14.5+ and conversion modeling documentation. https://www.facebook.com/business/help/331612538028890
- Google Ads Help: ROAS bidding and conversion value reporting. https://support.google.com/google-ads/answer/6268637
- Meta Ads Help: Purchase ROAS metric definition. https://www.facebook.com/business/help/2360940012828143
- OpenView Venture Partners: SaaS benchmarks reports. https://openviewpartners.com/blog/
- HubSpot: State of marketing reports and SMB benchmarks. https://www.hubspot.com/marketing-statistics
- Tomasz Tunguz: SaaS metrics and marketing efficiency essays. https://tomtunguz.com/
- Google: Privacy Sandbox for the Web (third-party cookie deprecation timeline). https://privacysandbox.com/
- Littledata: Ecommerce benchmark reports including RPV by industry. https://www.littledata.io/benchmarks
- Adobe Digital Insights: DTC and ecommerce analytics whitepapers. https://business.adobe.com/resources/digital-insights-reports.html
- WebKit (Apple): ITP 2.3 and Storage Access API documentation. https://webkit.org/blog/9521/intelligent-tracking-prevention-2-3/
- Google Analytics Help: GA4 attribution models and channel groupings. https://support.google.com/analytics/answer/10596866
- eMarketer / Insider Intelligence: DTC and digital ad spending reports. https://www.insiderintelligence.com/
- McKinsey: Periodic CMO and marketing-efficiency reports. https://www.mckinsey.com/capabilities/growth-marketing-and-sales/our-insights
- Marketing Week: UK and global marketing trade press, MER and ROAS coverage. https://www.marketingweek.com/
- Search Engine Land: Paid-search and attribution coverage. https://searchengineland.com/library/ppc
- Shopify Help Center: Analytics, sessions, and conversion reporting by traffic source. https://help.shopify.com/en/manual/reports-and-analytics/shopify-reports/report-types/default-reports/behaviour-reports
- Google Ads Help: Smart Bidding, target ROAS, and conversion-value optimization. https://support.google.com/google-ads/answer/7068440
- Meta Business Help: Attribution settings, click and view windows for ad reporting. https://www.facebook.com/business/help/458681590974355
- Backlinko: Marketing metrics and conversion benchmarks across industries. https://backlinko.com/conversion-rate-benchmarks
- Ahrefs: How to measure marketing channel performance and ROI. https://ahrefs.com/blog/marketing-roi/
- Semrush: Digital marketing benchmarks and channel performance data. https://www.semrush.com/blog/digital-marketing-statistics/
- TripleWhale: New customer acquisition cost (nCAC) and MER decomposition guide. https://www.triplewhale.com/blog/ncac-mer
- Common Thread Collective: The MER framework and prescriptive forecasting for DTC. https://commonthreadco.com/blogs/coachs-corner/marketing-efficiency-ratio-mer
- Modern Retail: How DTC brands rebuilt measurement after iOS 14.5. https://www.modernretail.co/marketing/how-dtc-brands-are-rethinking-attribution/
- eMarketer: US digital ad spending and retail media measurement trends. https://www.emarketer.com/content/us-digital-ad-spending-2025