
Part of the AEO Hub and AI Search Hub.
The first time a founder showed me their AI visibility dashboard in early 2025, it had one number on it: brand mention rate on ChatGPT. The number was going up, the founder was thrilled, and revenue was flat. The dashboard was not lying. It was answering the wrong question.
Across the 40-some properties I have instrumented and the 200-site Attrifast cohort I now look at every Monday, the gap between "we are getting cited more" and "we are getting paid more" is wide enough that a one-metric dashboard is almost always misleading. The discipline that has emerged in 2025-2026 around what to actually measure is genuinely better, but it has also accumulated about thirty plausible-sounding KPIs from vendor dashboards, blog posts, and YouTube influencers, and most teams cannot tell which ones earn rent.
This article is the 10 that do. Six measure whether AI engines know about you. Four measure whether knowing about you produced a customer. Together they are the scorecard that ties GEO effort to revenue. Skip either half and you are flying blind on one instrument. I will define each one, show how to measure it, give a benchmark from the cohort where I have one, and name the pitfalls that send the metric sideways.
Quick facts
| Spec | Value | Source |
|---|---|---|
| KPIs covered in this article | 10 | Attrifast practice + vendor convergence |
| Upstream (presence) vs downstream (revenue) split | 6 vs 4 | Attrifast framework |
| Healthy SMB citation rate range (per engine, BOFU set) | 5-30% | Attrifast cohort observation |
| Loamly audited brands scoring under 20 on visibility | 85.7% | Loamly research [1] |
| Median GA4 Direct that is actually AI-referred | 34% | Attrifast 200-site benchmark [2] |
| B2B SaaS conversion-rate lift, AI vs Google organic | 1.9x | Attrifast benchmark [2] |
| Per-engine RPV rank (cohort blended) | Perplexity $1.42, Claude $1.18, ChatGPT $0.87, Gemini $0.41, AIO $0.29 | Attrifast benchmark [2] |
| ChatGPT weekly active users (Q1 2026) | ~800 million | OpenAI / Reuters [3] |
| AIO appearance rate (Ahrefs, 146.1M SERPs, Sept 2025) | 20.5% of SERPs | Ahrefs [4] |
| Princeton GEO finding: lift from citations/stats | Up to 40% | Aggarwal et al. [5] |
| Typical SMB prompt set size | 50-200 prompts | Profound, Peec, Otterly product guides |
| Recommended review cadence | Weekly upstream / monthly downstream | Attrifast practice |
Why a 10-KPI scorecard (and not 30, and not 1)
Vendor dashboards typically ship 25-40 metrics because more metrics make the product look richer. Operator practice is the opposite: a small number of metrics that are clearly defined, clearly measured, and clearly actionable beats a wall of charts every time. The reason for 10 specifically is that it splits cleanly into the six upstream presence metrics that a prompt tracker can produce on its own and the four downstream revenue metrics that require a first-party attribution layer underneath.
| Cluster | Metric count | What it answers | Required infrastructure |
|---|---|---|---|
| Upstream visibility | 6 | Do AI engines know about us, and how prominently? | Prompt tracker (Profound, Peec, Otterly, SEOcrawl, Loamly) |
| Downstream revenue | 4 | Did the visibility produce paying customers? | Server-side referer + first-party attribution (Attrifast) |
The two clusters are designed to be read together, not separately. A team with strong upstream and weak downstream is winning citations and losing revenue, which is a content-distribution and engine-mix problem. A team with weak upstream and strong downstream is undercited but punching above its weight on the citations it has, which is usually a quality-over-quantity content profile that is hard to scale. A team with both strong is winning the program. A team with both weak is at the start.
The diagram is the operating model. Both columns feed the same scorecard, and the scorecard is what tells you whether the GEO program is working in dollar terms. With that frame in place, here are the ten.
1. Citation rate
Definition. The percentage of your tracked prompts on which your domain appears in the cited sources of an engine's answer over a window. If you track 100 prompts on ChatGPT and your domain is cited on 17, your ChatGPT citation rate is 17%.
How to measure. Pick a stable prompt set, log responses per engine per run, count the runs where your domain appears in the citation footnotes, divide by total runs. Done weekly, the resulting time series is your citation rate.
Benchmark. Across the 40 properties I have instrumented and informally against the larger 200-site Attrifast cohort: under 5% means you are not on the map for this prompt set; 5-15% means you are present but not winning; 15-30% means you are competitive; 30%+ means you are the recognized incumbent for the set on the engine. The Loamly research [1] that 85.7% of audited brands score under 20 on their visibility metric lines up with what I see in the wild.
Pitfalls. Citation rate is meaningless without a stable prompt set. Adding a prompt mid-quarter resets the trend. Removing a prompt because it is depressing is biased sampling. Compare across engines only if the prompt set is identical. Single-day readings on prompts with under five samples are anecdotal. The most common mistake is celebrating a citation rate jump that comes from a prompt-set change, not a real visibility gain.
2. Citation share / share of voice
Definition. Your citations as a share of all citations across all competitors on your prompt set in the window. If a 100-prompt run produces 400 total citations across all sources and your domain appears in 32 of them, your share of voice is 8%.
How to measure. Identical to citation rate, but the denominator becomes total citations across all sources rather than total prompts. You need to log the competitor citations too, not just your own.
Benchmark. Share of voice depends heavily on category density. In sparse categories with few competitors, single-digit citation rate can produce 25%+ share of voice. In dense categories (general SaaS productivity, ecommerce shopping queries), 5-10% share of voice is competitive. My standing rule: track citation rate for absolute progress and share of voice for competitive context. Both move independently. The dedicated share of voice in AI search methodology piece walks the formula in depth.
Pitfalls. Share of voice can fall while citation rate rises, because a new competitor entered the category. That is real, not noise. The number is also sensitive to how you define the competitor set; counting Reddit and Wikipedia as competitors will systematically deflate your share. The cleanest practice is to define a brand competitor set explicitly and compute share-of-voice within it, while separately tracking total source diversity.
3. Prompt coverage
Definition. The percentage of prompts in your defined set for which any engine surfaces a citation at all. Engine-side hygiene, not a brand metric.
How to measure. Per run, count prompts that produced at least one citation from any source (not just yours). Divide by total prompts in the set.
Benchmark. Across the 40 properties I have instrumented, healthy coverage sits between 78% and 94%. Below 70% your prompt set is too vague or too refusal-prone. The big drivers of low coverage: prompts that trigger safety refusals (medical, legal, financial advice), prompts that route to an engine surface that does not return sources (Claude conversation mode without web search enabled), and prompts that are too broad ("tell me about marketing").
Pitfalls. Mixing covered and uncovered prompts in your citation-rate denominator inflates noise. Always compute citation rate against the covered subset. Some engines refuse certain prompt types categorically, which is not a brand problem; it is a prompt-design problem.
4. Per-engine variance
Definition. The spread of citation rates across the engines you track for the same prompt set. A 22-31-9-14 split across ChatGPT, Perplexity, Claude, and AI Overviews has a 22-percentage-point variance.
How to measure. Compute citation rate per engine on the same prompt set in the same window. Take the range (max minus min) or, for more rigor, the standard deviation across engines.
Benchmark. Across the Attrifast cohort, B2B SaaS sites usually over-index on Perplexity and Claude (because technical buyers use those engines) by 10-20 percentage points; ecommerce sites usually over-index on ChatGPT by similar margins. A spread of 25 percentage points between engines is common and is usually fixable through targeted GEO work. A spread of 50+ percentage points usually means your content is structurally tuned for one engine's surface and ignored by another.
Pitfalls. Reporting only blended citation rate hides this signal entirely. Pure variance can also flatter you when one engine is small enough to be statistically noisy (Copilot with under 30 covered prompts). Always anchor variance reports to covered-prompt counts per engine.
5. Citation position
Definition. The average ordinal position your domain occupies in the citation list of an engine's answer over the window. If Perplexity cites four sources per answer and you are the third one cited on average, your citation position is 3.
How to measure. Per cited answer, log your domain's index in the engine's source list. Average across the window. Be honest about engine differences: some engines order by relevance, some by domain authority, some by chronology.
Benchmark. Positions 1-2 typically receive 60-75% of the citation-clicks within an answer (Perplexity is the only engine that publishes click-through data, and the rest are inferred from operator observation). Positions 3-5 get the remainder. Anything beyond position 5 is mostly invisible.
Pitfalls. Engines change citation ordering across model updates without notice. Comparing positions across engines is apples-to-oranges. Use position as a within-engine trend metric, not a cross-engine comparison. The metric also requires consistent parsing; if your parser breaks when an engine changes citation format, you will see a phantom position drop that is purely instrumental.
6. Citation freshness
Definition. The average age in days of the cited pages your domain appears on across your prompt set on a given engine. Younger means the engine is pulling recent content from you.
How to measure. Per cited URL, look up the page's datePublished or dateModified from the page schema (or your CMS). Compute days since publication. Average across all cited URLs in the window.
Benchmark. Across the Attrifast cohort, healthy freshness sits in the 60-180 day range for B2B SaaS, under 30 days for news verticals, over 365 days for evergreen reference content. The drift, not the absolute number, is the signal: an average cited-page age climbing month over month means you are losing the freshness battle.
Pitfalls. Some engines weight freshness aggressively for time-sensitive queries (news, software-version queries, "best 2026" listicles) and barely at all for evergreen ones (definitional, how-to). A single average across all prompt types is misleading. Segment freshness by query intent class to make it actionable.
| Metric | Owns measurement | What it answers | Common pitfall |
|---|---|---|---|
| Citation rate | Prompt tracker | Are we cited at all? | Prompt-set drift |
| Share of voice | Prompt tracker | Cited relative to competitors? | Competitor set ambiguity |
| Prompt coverage | Prompt tracker | Is the prompt set valid? | Mixing covered/uncovered |
| Per-engine variance | Prompt tracker | Where are we under-indexed? | Hidden by blended averages |
| Citation position | Prompt tracker | Are we prominently cited? | Parser fragility across engines |
| Citation freshness | Prompt tracker + page metadata | Are cited pages aging? | Intent-class mixing |
The six upstream metrics share a property: every one of them lives entirely inside the prompt-tracking world. None of them touches your revenue stream. That means a team that has only these six is answering "are we visible?" and not "is the visibility paying?" The next four close that gap.
7. AI direct vs AI referred share
Definition. AI referred is the share of your sessions that arrive with a recognized AI-engine referer. AI direct is the share of your Direct/(none) sessions that are actually AI-referred but had the referer stripped. The KPI is the ratio between the two.
How to measure. Server-side referer capture catches the referred half. Server-side fingerprinting (UTM patterns, landing-page heuristics, User-Agent inference, behavioral signature) recovers the direct half. GA4 alone catches only the referred half.
Benchmark. Across the Attrifast 200-site cohort, the median AI direct share is 34% of Direct sessions, with B2B SaaS at 41% and ecommerce at 22%. A healthy server-side setup recovers a 1:2 to 1:3 ratio (referred:direct), meaning you see roughly one-quarter to one-third of your true AI traffic through clean referrers alone.
Pitfalls. Fingerprinting precision is not perfect; the Attrifast layer runs at ~80% precision, and the remaining 20% is a known noise floor. Reporting AI direct as if it were ground truth is overconfident. Always present this as "fingerprinted AI direct + clean AI referred" with the precision band documented. The mechanics of why GA4 misses this traffic are in the GA4 missing traffic post and the dark AI traffic GA4 piece.
8. Citation-to-click rate
Definition. The percentage of citations that result in a measurable click to your domain. If you are cited on 50 Perplexity answers in a week and you receive 7 attributable Perplexity-referred sessions, your Perplexity citation-to-click rate is 14%.
How to measure. Pair prompt-tracking citation counts with server-side AI-referred session counts on the same engine in the same window. Divide.
Benchmark. Wildly variable by engine. Perplexity is the highest (often 10-25% because Perplexity links out aggressively). ChatGPT is moderate (3-10%). Google AI Overviews is low (estimated 2-4% based on Backlinko AIO research [6]). Claude is near zero in conversation mode (often unlinked mentions). The cross-engine variance here is the most important thing the metric reveals.
Pitfalls. Citation-to-click rate is impossible to measure if you cannot see the AI-engine sessions, which is the default GA4 state. It also has a denominator-counting problem: do you count each cited prompt-run once, or weight by prompt volume? I count prompt-runs, but be explicit about your method. Comparing across engines without normalizing for prompt volume is misleading.
9. Citation-to-conversion rate
Definition. The share of AI-engine-referred sessions that complete a defined conversion event (Stripe payment, signup, demo request) over a window, specifically on traffic from engines that cite you.
How to measure. Three joins: prompt tracker tells you which engines cite you; server-side referer tells you which sessions came from those engines; payment join tells you which converted. Multiply through.
Benchmark. Across the 200-site Attrifast cohort, AI-engine-referred sessions convert at roughly 1.9x Google organic for B2B SaaS (2.7% vs 1.4% on the same landing pages). The pattern reverses on ecommerce (Google organic 2.1% vs AI 1.6%) because shopping behavior favors impulse and retargeting. This single 1.9x number is the cleanest argument that AI traffic is worth measuring at all.
Pitfalls. The metric depends on consistent attribution windows. AI traffic disproportionately lands on deep pages, and deep-page conversion windows are longer than homepage windows. Use first-touch or position-based attribution honestly. The multi-touch case is in multi-touch attribution for AI search.
10. Revenue per AI-attributed visitor
Definition. Total revenue attributed to AI sessions divided by total AI sessions over a window. Per-engine, this becomes per-engine RPV.
How to measure. Sum payment-joined revenue from AI-attributed sessions; divide by total AI-attributed sessions. Repeat per engine.
Benchmark. Cohort blended per-engine RPV ranks Perplexity $1.42, Claude $1.18, ChatGPT $0.87, Gemini $0.41, AI Overviews $0.29. The ranking inverts for raw volume share: ChatGPT delivers 71% of AI sessions but only roughly one-third of AI revenue per visit. This is the single most useful KPI for prioritizing GEO investment by engine.
Pitfalls. RPV is dominated by deal-size mix; a single $5000 enterprise conversion can lift a small-cohort RPV by 50%. Use median RPV or trim the top decile for SMB cohorts. RPV also blends free-trial conversions with paid; segment by lifecycle stage if your business has a meaningful gap between them. The full benchmark dataset is in the AI traffic revenue benchmark 2026.
| Metric | Owns measurement | What it answers | Common pitfall |
|---|---|---|---|
| AI direct vs AI referred | Server-side analytics | Can we see our AI traffic? | Precision overstatement |
| Citation-to-click rate | Prompt tracker + analytics | Do citations send clicks? | Denominator counting method |
| Citation-to-conversion | Prompt tracker + analytics + Stripe | Do clicks convert? | Attribution window inconsistency |
| Revenue per AI visitor | Analytics + Stripe | Does AI traffic pay? | Deal-size outlier dominance |
The four downstream metrics share a property: every one of them requires a first-party attribution layer that GA4 cannot supply. That is the structural reason the Attrifast product exists. If you only have prompt-tracker data, you can never compute citation-to-conversion. If you only have GA4, you can never separate AI direct from human direct.
Putting the 10 into one scorecard
The trap is treating these as ten separate charts. They are one scorecard with two columns and four rows. Here is the format I use for the SaaS founders I help.
| Row | Metric (upstream) | Metric (downstream) |
|---|---|---|
| Presence | Citation rate | AI direct vs AI referred |
| Mix | Per-engine variance | Citation-to-click by engine |
| Quality | Citation position + freshness | Citation-to-conversion |
| Outcome | Share of voice | Revenue per AI visitor |
Each row reads horizontally as a question. Row 1 asks "are we even on the map and can we see it?" Row 2 asks "where are we strong by engine, and which of those engines actually send clicks?" Row 3 asks "are we prominently cited on fresh content, and does that produce paying customers?" Row 4 asks "do we own meaningful share, and does that share carry dollars?" If any row fails, the program has a specific problem; if all four pass, the program is working.
For a starting team I recommend implementing rows 1 and 4 first (citation rate, AI direct vs referred, share of voice, RPV) because they cover the largest possible information surface with the fewest metrics. Rows 2 and 3 add diagnostic depth.
What review cadence actually works
Weekly for the upstream metrics, monthly for the downstream metrics, quarterly for goal-setting.
Weekly works for citation-side metrics because prompt-tracker data refreshes that fast and the engines' citation behavior shifts on weeks, not hours. Monthly works for revenue-side metrics because attribution windows on first-month subscriptions need 30+ days to settle, and AI-traffic deal-size patterns require enough volume to denoise. Quarterly works for goal-setting because GEO investments take 8-12 weeks to show up as citation movement, and adjusting goals more often produces whiplash.
| Cadence | Metrics reviewed | Time budget | Decision authority |
|---|---|---|---|
| Daily | None (noise) | 0 minutes | None |
| Weekly | Citation rate, prompt coverage, per-engine variance | 15 minutes | Content priority, alert investigation |
| Monthly | All 10, with focus on downstream | 60 minutes | Engine mix, GEO investment level |
| Quarterly | All 10, plus comparison to prior quarter | 2 hours | Strategy, prompt-set revision, budget |
The single most common cadence mistake is reviewing downstream metrics weekly. Revenue numbers on a weekly cadence with cohort sizes under 10,000 sessions are noisy enough to drive bad decisions. Wait a month.
What to do when a KPI moves
A metric moving 5% in either direction is noise on most prompt-set sizes. A metric moving 20%+ in a week deserves investigation. The pattern I use for investigation is upstream-first: if citation rate dropped, check prompt coverage and per-engine variance to see whether the issue is whole-engine (likely a model update or your domain dropped out of training corpus) or prompt-specific (likely a competitor took the prompts). Then check downstream: did revenue per visitor drop in parallel (real traffic loss), or hold up (engines shifted but conversions kept pace)?
The most expensive mistake is treating a single noisy reading as ground truth and ripping up content based on it. I have watched teams rewrite an entire pillar page in response to a one-week citation-rate dip that was a Perplexity index refresh, not a problem with the page.
FAQ
What KPIs should I track for AI visibility in 2026?
Ten earn their place: citation rate, share of voice, prompt coverage, per-engine variance, citation position, citation freshness, AI direct vs AI referred share, citation-to-click rate, citation-to-conversion rate, and revenue per AI-attributed visitor. The first six measure presence in answer engines; the last four measure whether that presence pays. Most teams I see in 2026 are tracking only the first two and skipping the four that connect to dollars. The honest scorecard combines both halves.
What is citation rate and how is it different from share of voice?
Citation rate is the percentage of your tracked prompts on which your domain appears in the cited sources of an engine's answer over a window. Share of voice goes one step further by counting your citations as a share of all citations across all competitors on the same prompt set. Citation rate is your absolute presence; share of voice is your relative presence. They move independently — a competitor entering the market can drop your share of voice while your citation rate stays flat.
What is prompt coverage and why does it matter separately?
Prompt coverage is the percentage of prompts in your set for which any engine surfaces a citation at all. It is engine-side hygiene, not a brand metric. If 12% of your prompts produce no citations on any engine, that 12% slice is broken from a measurement standpoint. Prompt coverage matters because the denominator of your citation rate has to be prompts where citation is possible. Across the 40 properties I have instrumented, coverage typically sits between 78% and 94%.
What does per-engine variance tell you?
Per-engine variance is the spread of citation rates across the engines you track for the same prompt set. Wide variance is a strategic signal: it tells you which engine you are over- or under-indexed on. Across the Attrifast cohort, B2B SaaS over-indexes on Perplexity and Claude, ecommerce over-indexes on ChatGPT. A 25-percentage-point spread is common and usually fixable through targeted GEO work.
What is citation-to-conversion rate?
The share of your AI-engine-referred sessions that complete a defined conversion event over a window, specifically on traffic attributable to engines on which you are cited. It is the single most important AI revenue metric, requiring three joins: prompt tracker tells you which engines cite you, server-side referer tells you which sessions came from those engines, payment join tells you which converted. GA4 cannot do this on its own. Across the Attrifast cohort, AI-referred sessions convert at roughly 1.9x Google organic for B2B SaaS.
How does AI direct vs AI referred matter as a KPI?
It is the diagnostic for whether your attribution is working at all. AI referred is sessions with a recognized AI-engine referer; AI direct is the share of Direct/(none) sessions that are actually AI-referred but had the referer stripped. Across the cohort the median AI direct share is 34% of Direct, with B2B SaaS at 41%. Without server-side fingerprinting, AI direct is invisible and your AI traffic share looks two-thirds smaller than it actually is.
What is a reasonable citation rate benchmark to target?
For a defined prompt set of 50-200 buyer-intent prompts, double-digit citation rate on at least one engine is a real outcome. Across the properties I have watched, distribution is: under 5% means not seen, 5-15% means present but not winning, 15-30% means competitive, 30%+ means incumbent. Different engines weight differently, so the same brand often sits in different bands on different engines.
How often should AI visibility KPIs be reviewed?
Weekly for upstream metrics, monthly for downstream metrics, quarterly for goal-setting. Weekly works for prompt-tracker data because the engines shift on weeks. Monthly works for revenue metrics because subscription attribution windows need 30+ days to settle. Quarterly works for goals because GEO investments take 8-12 weeks to show up.
Does GA4 give you any of these metrics out of the box?
Almost none, and the ones it appears to give are misleading. GA4 has no concept of citation rate, share of voice, prompt coverage, or per-engine variance. On the traffic side it can show sessions from chat.openai.com or perplexity.ai if the referer survives, but most AI traffic arrives without one and lands in Direct/(none). Conversion measurement is lossy because the GA4 last-non-direct attribution rule reassigns the conversion away from AI. GA4 is the wrong instrument for every metric in this article.
What is revenue per AI-attributed visitor and why does it beat conversion rate alone?
RPV is total revenue attributed to AI sessions divided by total AI sessions. It beats conversion rate alone because conversion rate ignores deal size. Across the cohort, per-engine RPV ranks Perplexity $1.42, Claude $1.18, ChatGPT $0.87, Gemini $0.41, AI Overviews $0.29. The ranking inverts for raw volume: ChatGPT delivers 71% of AI sessions but only one-third of AI revenue per visit. RPV is the most useful number for prioritizing GEO effort by engine.
What is citation freshness and when should I worry about it?
Citation freshness is the average age in days of the pages your domain is cited from across your prompt set on a given engine. Younger is better. Freshness drift is the metric: if your average cited-page age is climbing month over month, you are losing the freshness battle. Across the cohort, healthy freshness sits in 60-180 days for B2B SaaS, under 30 for news verticals, over 365 for evergreen reference. Worry when it climbs faster than your publishing cadence.
Which of these KPIs should I track first if I am starting from zero?
Three. AI direct vs AI referred share, because if you cannot see your AI traffic, every other metric is theoretical. Citation rate on a 50-prompt set across two engines (ChatGPT and Perplexity), because that tells you whether you are on the map. Revenue per AI-attributed visitor, because that tells you whether the traffic pays. Add the other seven over the following two quarters as the program matures. Trying to instrument all ten at once is the most common reason teams give up.
Does Attrifast track these KPIs?
Attrifast tracks the four downstream revenue-side metrics natively. It does not track the upstream prompt-tracking metrics — those come from a dedicated prompt tracker like Profound, Peec, SEOcrawl, or Otterly. The intended stack for a complete AI visibility scorecard is a prompt tracker for the upstream half plus Attrifast for the downstream half, joined on the engine name. That is the only way to compute KPIs like citation-to-conversion that span both layers.
Related reading from the Attrifast research stack
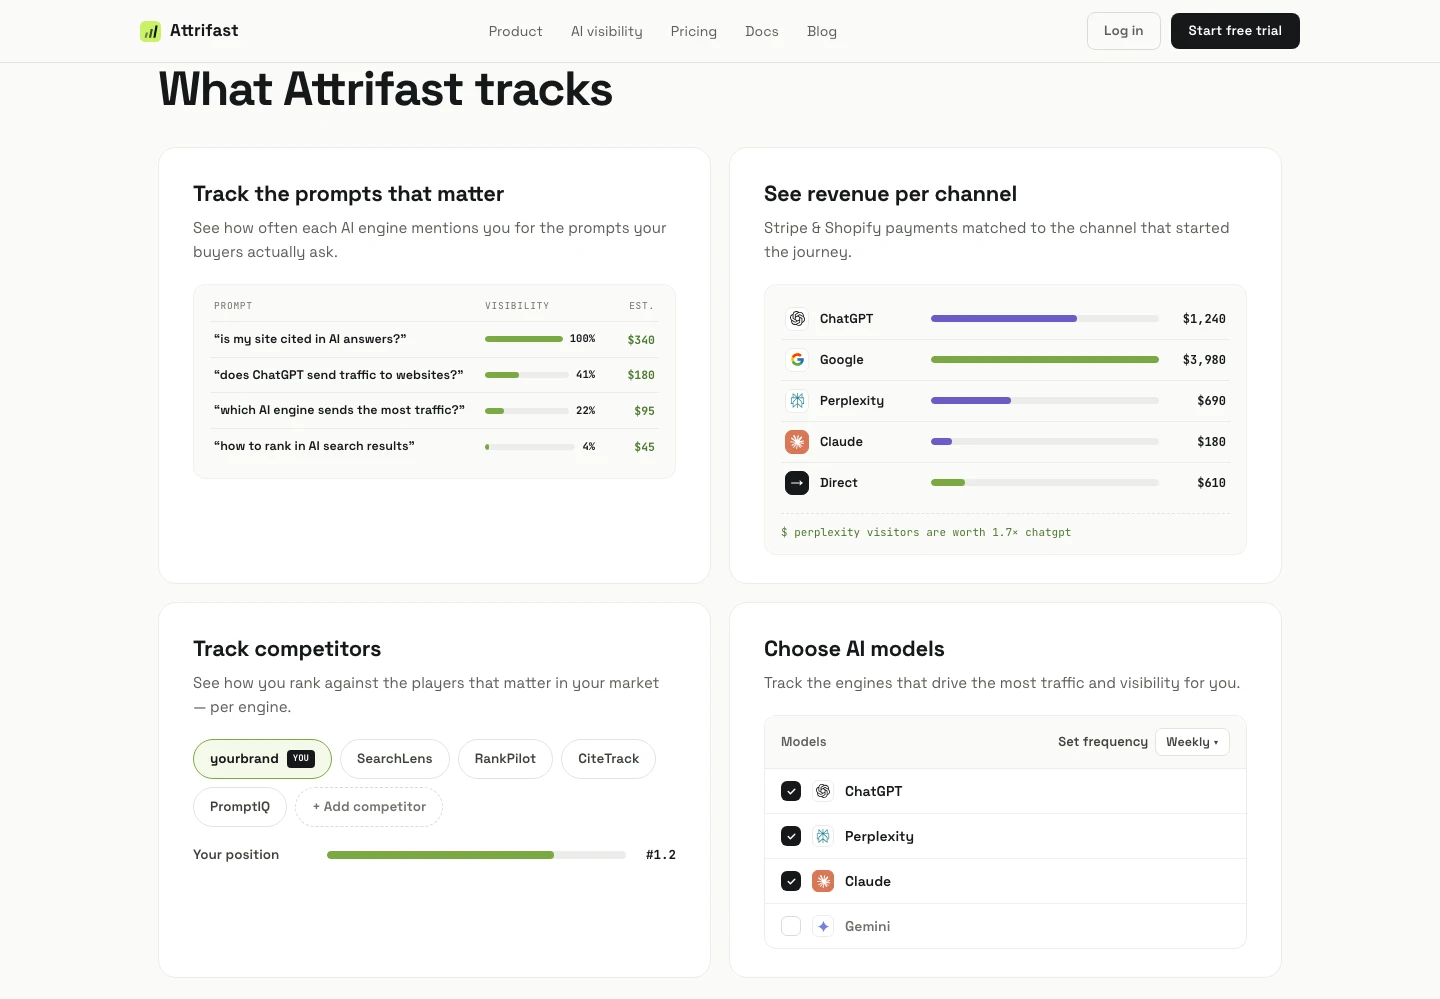
For related deep-dives, see The Indie Hacker's Marketing Analytics Stack and ROAS vs MER vs RPV: The 2026 Marketing Metric Showdown. See also AI visibility KPIs to track. For the upstream prompt-tracking metrics this article only measures the downstream half of, see what is prompt tracking and how to measure share of voice in AI search; for the downstream revenue half Attrifast actually ships, see revenue attribution.
Sources
- Loamly — AI visibility audit and intelligence research
- Attrifast — AI traffic revenue benchmark 2026 (200-site cohort)
- OpenAI / Reuters — ChatGPT weekly active users and reach
- Ahrefs — What triggers AI Overviews? 86 factors and 146 million SERPs analyzed (20.5% of SERPs, September 2025)
- Aggarwal et al., Princeton — GEO: Generative Engine Optimization
- Backlinko — How AI Overviews are affecting organic CTR
- Profound — Answer Engine Insights — AI search visibility platform
- Peec AI — AI search visibility tracking
- SEOcrawl — Prompt tracking SEO software
- Otterly.AI. Brand monitoring for AI search engines
- Google Analytics Help — Default channel groups and attribution windows
- Ahrefs — Generative Engine Optimization: Growth Strategies and Metrics For the AI Era
- Semrush — AI Overviews and generative search visibility
- Google Search Central blog — Generative AI in Search
- OpenAI — GPTBot and ChatGPT bot documentation
- Anthropic — ClaudeBot and Claude search documentation
- Perplexity — Perplexity bots and citations FAQ
- Cloudflare Radar — AI bot traffic share
- Similarweb — AI chatbot and search engine traffic data
- Stripe — Checkout session metadata and attribution joins
For the upstream half of the scorecard, see what is prompt tracking. For the methodology behind the share-of-voice metric specifically, see how to measure share of voice in AI search. For the downstream half tied to engines, see the per-engine revenue benchmark and the revenue attribution feature page. For the engine-level tracking pages, see ChatGPT, Perplexity, Claude, and Gemini.