A founder I will call Marcus messaged me the night before his board meeting last quarter. He had spent five months and roughly fourteen thousand dollars building a GEO program — new question-shaped content, schema, author identity, the whole playbook — and the citations had genuinely taken off. His vendor dashboard showed a visibility score that had climbed from the low twenties into the sixties and a citation count up nearly ten-fold. He had a beautiful slide. The problem, he wrote, was that his lead investor was a former SaaS CFO, and the last time someone showed that investor a visibility chart, the investor had asked one question that ended the conversation: "How much money did it make us?" Marcus did not have a clean answer, and he was about to walk into the same trap with a prettier chart.
I have watched some version of that meeting happen more than a dozen times in the last eighteen months. It is almost never a measurement failure on its own — plenty of teams have the citation data — it is a reporting failure. They built the program, they instrumented some of it, and then they walked into the room with the metrics they were proud of instead of the metrics leadership can act on. This article is the companion to my piece on how to measure GEO ROI; that one is the methodology for getting the number, joining AI traffic to Stripe and computing a defensible return with confidence intervals. This one assumes you have that number, or are building toward it, and answers the harder political question: how do you present it to a CEO, a CFO, and a board so the program survives and gets funded. Measuring it is engineering. Reporting it is translation. Most teams are good at the first and lose the budget on the second.
Quick Facts
| Metric | Value | Source |
|---|---|---|
| The only question leadership asks | "How much money did it make us?" | This playbook |
| Share of GA4 Direct that is actually AI-referred (cohort median) | 34% (IQR 21-47%) | Attrifast 200-site cohort [13] |
| How much the median SMB under-counts AI traffic | ~64% vs server-side recovery | Attrifast 200-site cohort [13] |
| AI-attributed traffic monthly growth (cohort) | ~13.4% compounded | Attrifast 200-site cohort [13] |
| Google organic monthly growth (same cohort) | ~1.1% | Attrifast 200-site cohort [13] |
| AI-source conversion vs Google organic (B2B SaaS) | ~1.9x (2.7% vs 1.4%) | Attrifast 200-site cohort [13] |
| Marketers who cannot tie spend to revenue cleanly | A persistent majority | McKinsey marketing analytics [1] |
| CMOs under pressure to prove marketing ROI | The dominant CMO mandate | Gartner CMO research [2] |
| Boards that want defensibility, not activity | Standard board reporting norm | CFO.com board reporting [9] |
| AI-engine reach (US adults using AI tools) | A large and growing share | Pew Research [12] |
| Earliest defensible AI search payback read | ~90-120 days after first publish | This playbook |
Everything in this article is downstream of one fact in that table: leadership asks "how much money did it make us," and the default GEO toolchain answers a different question. The rest of the piece is about closing that gap on the slide — translating leading indicators into revenue, giving each stakeholder the cut they actually want, presenting attribution with error bars that build rather than erode credibility, and structuring the report so the one number that matters lands instead of drowning.
The core problem: GEO produces the wrong metrics for the room
The structural problem with reporting AI search ROI is that GEO programs generate leading indicators while leadership makes decisions on lagging ones, and the gap between the two is where budgets die. Your vendor dashboard is excellent at telling you that AI engines are citing you more, that your visibility score climbed, that your share-of-voice grew. None of those are the number a CEO allocates budget against. The CEO allocates against revenue, cost, and payback — and by default, the revenue is not in your dashboard at all, it is hidden in GA4's Direct bucket because AI clients strip the referrer on most outbound clicks. So you walk into the room holding the metrics you can see and missing the metric they want.
Here is the mismatch laid out plainly. The left column is what a GEO program naturally produces. The right column is what the person across the table is actually deciding on.
| What GEO produces (and you can see) | What leadership decides on (and you usually can't see) |
|---|---|
| Citation count | AI-attributed revenue |
| Visibility / SOV score | Payback period |
| AI crawler hits | Revenue per visitor by engine |
| AI referral session count | AI-influenced pipeline / new MRR |
| Pages shipped, schema added | Channel mix vs other acquisition |
| "The program is active" | "The program returns money / is defensible" |
Every row on the left is real and useful — for steering the program. Not one of them answers "how much money did it make us." This is the same measurement-maturity gap McKinsey has documented in traditional marketing for years, where a persistent majority of marketers still cannot tie spend cleanly to revenue[1], and Gartner's CMO research frames proving marketing ROI as the dominant pressure on the role[2]. AI search did not create the gap; it widened it, because the revenue signal is now structurally invisible in the default analytics tool.
The hidden-revenue half of the problem is specific and quantifiable. Across the 200 Stripe-connected sites I track in the AI traffic revenue benchmark, a median of 34% of what GA4 labels "Direct/(none)" is actually AI-referred traffic, and the typical SMB under-counts AI traffic by roughly 64% versus what server-side attribution recovers[13]. So even a diligent operator who pulls the GA4 channel report and looks for AI is looking at a number that is structurally close to zero for AI engines — which is worse than having no number, because it actively misleads the room into thinking the channel is tiny.
The diagram is the whole problem in one picture. The program produces leading indicators you can see and revenue you can't, the revenue requires a join to Stripe to surface, and if you put the leading indicators on the slide instead, the CEO asks the question that ends the meeting. The rest of this article is the right-hand path: how to surface the revenue and frame it so the report funds the program instead of getting it cut.
What each stakeholder actually wants — and how to frame it for them
The single biggest leverage move in AI search reporting is realizing you are not writing one report — you are writing one set of numbers framed four ways, because a CEO, a CFO, a CMO, and a board each ask a different question and need a different emphasis. The revenue number underneath is the same. The framing on top is not. Hand a CFO the CMO's channel-mix narrative and they will hunt for the attribution holes; hand a board the CFO's attribution-confidence detail and they will glaze over. Match the cut to the chair.
Here is the map I use. Each row is a stakeholder, the question they are actually asking under whatever they said out loud, the one metric that answers it, and the framing that lands.
| Stakeholder | The question they're really asking | The metric that answers it | How to frame it |
|---|---|---|---|
| CEO | "How much money did it make us, and how fast does it pay back?" | AI-attributed revenue + payback period | Revenue first, payback second, growth rate third — one sentence, no hedging on the headline |
| CFO | "Can I trust this number, and what did it cost?" | Fully loaded cost + attribution confidence range | Show the join method, the confidence range, confirmed vs inferred split |
| CMO | "Where does this fit in my channel mix and which way is it trending?" | AI as a row in the channel-mix table + trend | Same table as Google/paid/email, revenue-per-visitor comparable, trend arrow |
| Board | "Is this defensible, or is it a fad I'm funding?" | Trajectory + intent quality + moat | Growth rate vs other channels, conversion premium, compounding-content argument |
| Marketing team | "What's working so I can do more of it?" | Citation rate + RPV by topic/page | Leading indicators welcome here — this is the operational view |
Read the table top to bottom and notice the metric shifts even though the underlying data does not. The CEO row is about magnitude and speed. The CFO row is about trust. The CMO row is about position. The board row is about durability. The marketing-team row is the only one where leading indicators belong on the headline, because that is the operational audience that uses them to steer.
Let me make each framing concrete, because "frame it for the CFO" is useless advice without the actual sentences.
For the CEO, the entire report compresses to one sentence they can repeat to their own boss: "AI search drove an estimated $3,800 a month in new revenue on $1,450 of cost — roughly a four-month payback — and it's our fastest-growing acquisition channel at 13% month over month." Revenue, cost, payback, trajectory, in that order, with no citation count anywhere near it. A CEO does not allocate budget against a 9x citation lift because a citation is not a dollar; they allocate against a number they can compare to every other line competing for the same dollar.
For the CFO, the same revenue number arrives wrapped in its methodology, because a CFO is not skeptical of AI search — they are skeptical of attribution. The sentence that wins them is: "Here are the 19 customers, here is the Stripe payment for each, here is the AI-engine session that originated or assisted it, and here is the join method per customer — the headline uses assisted attribution on confirmed sessions only, with a range of 79% to 259% across models." Specific, joined, and ranged. The CFO's follow-up is always about confidence, so you lead with the confidence framing rather than waiting to be asked.
For the CMO, AI search is a row in the channel-mix table they already look at, not a separate science project. The framing is: "AI engines are now 13.7% of B2B SaaS revenue in the benchmark, converting at 1.9x Google organic, and they're the only channel growing double digits monthly." Put it next to the other channels in comparable units. A CMO's instinct is to manage the portfolio, so give them the portfolio view.
For the board, the question is durability, and the framing is three pillars: trajectory (compounding 13.4% monthly vs Google's 1.1%), intent quality (1.9x conversion premium because buyers arrive pre-informed), and moat (citations accrue to content with existing authority, so an early instrumented program builds a position competitors cannot quickly buy)[13]. The revenue number is the proof the trajectory is already paying; the three pillars are the argument it will keep paying.
The leading-vs-lagging translation table — what to take off the slide and what to put on
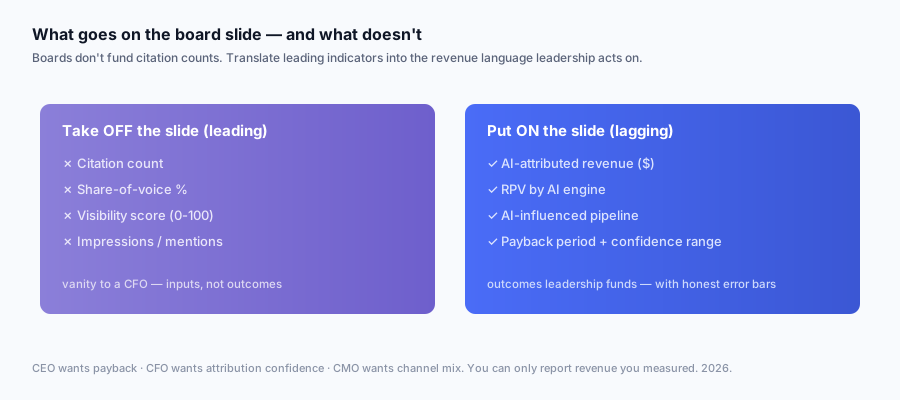
The mechanical core of good AI search reporting is a translation step: for every leading indicator you are tempted to show leadership, there is a lagging revenue metric you should show instead, and learning that mapping is most of the job. Leading indicators belong on your operational dashboard for steering the program. Lagging indicators belong on the leadership slide for deciding its fate. Putting a leading indicator on the leadership slide and calling it ROI is the original sin of GEO reporting, and it is the mistake that most reliably gets budgets cut, because it trains leadership to see the channel as unmeasured activity rather than a funded, returning line.
Here is the translation table — the most important table in this article. The left column is what teams instinctively put on the slide. The right column is what they should put there instead, and why.
| Take OFF the leadership slide (leading) | Put ON the leadership slide (lagging) | Why the swap |
|---|---|---|
| Citation count ("9x more citations") | AI-attributed revenue ($ joined to Stripe) | Citations are upstream of revenue; a board can't bank a citation |
| Visibility / share-of-voice score | Revenue per visitor (RPV) by engine | SOV measures real estate, not money; RPV measures money per click |
| AI crawler hits (GPTBot activity) | Payback period (cost / monthly run-rate) | Crawler hits mean "seen," not "paid"; payback is the budget decision |
| AI referral session count | AI-influenced pipeline / new MRR | Sessions are traffic; pipeline and MRR are the funnel outcome |
| "Visibility score 61/100" | Channel-mix position (AI vs other channels) | A score is a vendor index; channel mix is a portfolio decision |
| Pages shipped / schema added | Quarter-over-quarter revenue trend | Output is effort; trend is whether the effort compounds |
| "1300% impressions lift" | Conversion rate vs other channels | Impressions are top-of-funnel; conversion is intent quality |
The discipline is not to throw the left column away — it is to relocate it. Every leading indicator on the left is genuinely useful, and you will use it weekly to steer. It just does not go on the slide that decides budget. When the CFO asks "how confident are you in that revenue number," the leading indicators come out of the appendix as supporting evidence — "citations are up 9x, crawler activity is up, AI sessions are up 4x, which is consistent with the revenue we're seeing land." That is their proper role: corroborating the lagging number, not substituting for it.
A useful mental model: the leading indicators are the inputs to a machine, and the revenue is the output. A board does not buy a factory based on how much raw material is going in; they buy it based on how much product is coming out and what it sells for. Show them the product.
The diagram shows the two destinations. Every leading indicator routes both ways — it goes to the operational dashboard where you use it raw, and it gets translated into a lagging metric for the leadership slide. Nothing gets discarded. Everything gets put in the room where it belongs.
A worked example: the one-slide AI search board update
Let me build the actual artifact, because every team I talk to wants to see the slide, not a description of the slide. What follows is a mock one-slide quarterly board update for an illustrative bootstrapped B2B SaaS, with numbers calibrated to be consistent with the 200-site benchmark cohort — not flashy, deliberately modest, because modest-and-defensible is the credible register in front of a board. I will give you the slide, then the talk track for each line, because how you say it matters as much as what is on it.
THE SLIDE — "AI Search: Q1 2026"
| Metric | This quarter | Last quarter | Trend |
|---|---|---|---|
| AI-attributed new revenue (monthly run-rate) | $3,800 | $2,100 | +81% |
| Fully loaded cost (monthly) | $1,450 | $1,450 | flat |
| Payback period | ~4.6 months | ~8.3 months | improving |
| AI share of new-customer revenue | 13.7% | 8.9% | +4.8pp |
| Conversion rate vs Google organic | 1.9x | 1.7x | improving |
| Confirmed vs inferred revenue split | $3,800 / +$1,000 inferred | $2,100 / +$600 | — |
That is the whole slide. Six rows, every one a lagging revenue metric, every one comparable quarter over quarter, with the confirmed-vs-inferred split sitting at the bottom so the CFO sees you are not hiding the soft number. No citation count. No visibility score. Those live in the backup slide.
Now the talk track, line by line, because a board update is a verbal performance with a slide as a prop, not a slide you read aloud.
Line 1 (revenue): "AI search is now driving about $3,800 a month in new revenue, up from $2,100 last quarter — that's an 81% increase, and it's the line I most want you to see." Lead with the money. Say the growth. Stop. Do not bury it under context.
Line 2 (cost): "It costs us a fully loaded $1,450 a month — that includes content, the attribution tooling, and an honest allocation of my time, not just the subscription." The "not just the subscription" clause preempts the CFO's first objection. A cost number that ignores labor is the fastest way to lose a finance person's trust.
Line 3 (payback): "So payback is roughly 4.6 months and improving — it was 8.3 months last quarter as the program ramped." Payback is the number a CEO can compare to every other channel. Naming the improvement tells them the trajectory is the right direction.
Line 4 (channel share): "AI engines are now about 13.7% of our new-customer revenue, up from 8.9% — this is no longer a rounding error, it's a top-three acquisition channel." This reframes AI from experiment to portfolio line, which is the framing that protects the budget.
Line 5 (conversion): "And the quality is high — AI-sourced visitors convert at about 1.9x our Google organic rate, because they arrive having already read a synthesized answer about us." This is the intent-quality argument that explains why the revenue is real, not just that it is.
Line 6 (confidence): "One honesty note: $3,800 is confirmed revenue — sessions we can tie to an AI engine with certainty. There's another ~$1,000 we strongly suspect is AI but can only infer, so I'm reporting it separately rather than folding it in." This line is the credibility line. Volunteering the soft number, in its own column, before anyone asks, is what makes the hard number believable.
The whole talk track is ninety seconds. It answers "how much," "what did it cost," "how fast does it pay back," "where does it fit," "is it real," and "can I trust the number" — in that order, which is the order the room is thinking in. Run your own figures through the marketing ROI logic in the measurement guide before you build this slide so the numbers reconcile.
Confidence honesty: presenting attribution with error bars that build credibility
The counterintuitive truth at the center of this whole topic is that under-claiming makes your number more persuasive, not less, because a sophisticated finance leader trusts a ranged estimate with named assumptions far more than a suspiciously precise point number that hides its own uncertainty. AI search attribution is built on detection that is partial, inference that is probabilistic, and an attribution model that is a choice — and a point estimate like "312% ROI" pretends none of that is true. A CFO who has seen a thousand marketing decks reads false precision as either naivety or spin. A range with stated assumptions reads as someone who understands their own data.
There are three honesty moves, and they compound. Here they are, with what each one does for your credibility.
| Honesty move | What it looks like on the slide | What it buys you |
|---|---|---|
| Under-claim | "Detection is conservative; the true number is likely higher" | Removes the incentive for the CFO to discount your number |
| Show the methodology | "Stripe payments joined to AI sessions; assisted model; confirmed only" | Lets the CFO audit it instead of distrusting it |
| Separate confirmed from inferred | Two columns: confirmed revenue, inferred revenue | Lets the skeptic take only the hard number and still see a return |
The first move — under-claiming — is the most counterintuitive and the most powerful. Because detection misses some AI sessions (the referrer is stripped, the heuristic misses some), your reported revenue is a floor, not a ceiling. Saying so out loud — "this is conservative, the real number is probably higher" — does two things: it is true, and it flips the CFO's instinct. Instead of mentally discounting your number for optimism, they mentally adjust it upward for conservatism. You have turned the uncertainty into an asset.
The second move is showing the range across attribution models, because the model choice changes the answer materially and pretending otherwise is the kind of thing that detonates in the Q&A. Here is the same cohort run three ways, calibrated to the worked example above.
| Attribution model | What it credits to AI | AI-attributed revenue (confirmed) | Implied payback |
|---|---|---|---|
| First-touch | Full credit if AI was the first session | ~$5,200/mo | ~3.3 months |
| Assisted / position-based | Partial credit when AI was any touch | ~$3,800/mo | ~4.6 months |
| Last-touch | Full credit only if AI closed the deal | ~$2,600/mo | ~6.7 months |
The way you present this to a board is not as confusion but as a defensible range with a named headline: "Our headline uses the assisted model — $3,800 a month — because it's the fairest single view for a discovery channel like AI. The conservative floor, if you only credit AI when it directly closed the sale, is $2,600. The optimistic ceiling, crediting AI for every discovery, is $5,200. We're reporting the middle." That sentence makes you the most credible person in the room, because you showed the spread instead of hiding it.
The third move — separating confirmed from inferred — is the one that wins the genuine skeptic. The confirmed bucket is revenue from sessions you can tie to an AI engine with a referrer or a user-agent match. The inferred bucket is revenue from sessions you strongly suspect are AI (no referrer, deep-page entry on conversational content, new visitor) but cannot prove. Folding inferred into confirmed is dishonest. Reporting them in two columns lets the hardest skeptic at the table take only the confirmed number and still see a positive return — which means even the worst-case reading of your data funds the program.
The diagram shows why the two-column split is the highest-leverage honesty move: it routes every dollar into either the bankable column or the flagged-upside column, so the headline rests entirely on the hard number and the soft number is pure disclosed upside. The skeptic cannot dismiss your case by attacking the inference, because your case never depended on it.
One more honesty discipline: report the n. "These 19 customers" is a far more credible statement than "AI-attributed revenue," because small-n is honest about its own volatility. A board can handle "this is 19 customers and the error bars are wide because the sample is small." What a board cannot forgive is discovering later that your confident percentage rested on a handful of conversions you never disclosed the count of.
Common reporting mistakes that get budgets cut
I have watched enough of these meetings to catalog the specific reporting mistakes that kill AI search budgets, and they are almost never about the program working — they are about the program being reported badly. The frustrating part is that a working program with a bad report loses to a mediocre program with a good report, every time, because the budget decision is made on the report, not on the underlying reality. Here are the six that recur, each with the fix.
| Mistake | Why it cuts the budget | The fix |
|---|---|---|
| Reporting citations/SOV as ROI | Leadership concludes the channel is unmeasured | Translate to revenue; relegate citations to appendix |
| Suspiciously precise point estimate | CFO reads false precision as naive or spun | Report a range with named assumptions |
| Ignoring or under-counting cost | Ratio looks fake once labor is added back | Fully load the cost, including your time |
| Reporting before the conversion lag elapses | Early number is artificially low, anchors negatively | Report leading indicators + expected payback first 90-120 days |
| Burying revenue under leading-indicator charts | The one number that matters never lands | Lead with revenue; one slide; charts go to backup |
| Presenting AI search as a science project | Signals it's experimental and therefore cuttable | Put it in the existing channel-mix report as a normal line |
Let me expand the two that do the most damage.
The fourth mistake — reporting before the conversion lag has elapsed — is the one that ambushes diligent operators specifically, because the diligent ones report early to show progress. But AI search revenue trails the cost by the normal content-to-payment lag, which for bootstrapped SaaS clusters at 30-60 days from first session to first paid conversion. If you report ROI at day 45, the cost is fully in and the revenue has barely started, so your ratio looks terrible — and that terrible number anchors leadership's perception of the channel for quarters afterward. The fix is to report the right metric for the right moment: in the first 90-120 days, report leading indicators and an expected payback, then convert to actual payback once a full conversion cycle of joined data exists. Reporting a payback period before revenue has had time to land signals you do not understand your own funnel.
The sixth mistake — presenting AI search as a separate science project — is the subtlest and the most lethal. When you give AI search its own special deck with its own special metrics, you are implicitly telling leadership it is experimental, separate, and therefore optional. The moment budgets tighten, the science project is the first thing cut, because it never became a normal part of how the business measures acquisition. The fix is structural: AI search should appear as a row in the same channel-mix table as Google organic, paid, and email, measured in the same units, reported on the same cadence. A channel in the portfolio gets defended like a channel. A science project gets cut like a science project. This is also why measuring AI traffic the same way you measure everything else — joined to Stripe — matters beyond the number itself: it earns AI search a seat in the report that already runs the business. The deeper question of whether the channel deserves that seat is the subject of is AI traffic worth it and does GEO actually drive revenue.
There is a seventh mistake worth naming separately because it is about comparison: forcing a cross-channel comparison when the channels are measured differently. It is tempting to show AI search next to paid search in one table, but if AI search is measured by a first-party Stripe join and paid search is measured by the ad platform's self-reported conversions, you are comparing apples to oranges and a sharp CFO will catch it instantly. The credibility damage from one caught inconsistency contaminates every other number on the slide. The fix is to either measure all channels the same way before you compare them, or present AI search on its own terms and explicitly note the comparison is not yet apples-to-apples.
The reporting cadence: monthly operational vs quarterly board
The structural fix that prevents most reporting mistakes is running two distinct cadences with two distinct audiences and two distinct metric sets, because the metric, the audience, and the frequency have to match. The monthly operational report is for steering and lives with you and your marketing leader; it is dense with leading indicators because those are what you steer on. The quarterly board report is for deciding budget and lives with the CEO and board; it is sparse, revenue-only, one slide plus backup. The mistake is mixing them — reporting leading indicators to the board monthly trains them to see AI search as an activity, and reporting revenue to yourself only quarterly is too slow to course-correct the program.
Here is the split, side by side.
| Dimension | Monthly operational report | Quarterly board report |
|---|---|---|
| Audience | You + marketing leader | CEO + board |
| Purpose | Steer the program | Decide the budget |
| Primary metrics | Leading indicators + early revenue | Lagging revenue only |
| Citations / SOV | Front and center | Appendix only |
| AI referral sessions by engine | Yes, detailed | Rolled into channel mix |
| Revenue | Confirmed MTD, detailed by topic | Run-rate, payback, trend |
| Format | Dashboard / multi-page | One slide + backup |
| What it changes | Tactics (what to write next) | Budget (fund or cut) |
The monthly report is where the leading indicators get to be the stars, because steering the program is exactly what they are good for. A practical monthly structure:
| Monthly section | What's in it | Decision it drives |
|---|---|---|
| AI referral sessions by engine | ChatGPT, Perplexity, Claude, Gemini volume + trend | Which engines to optimize for |
| Citation rate by topic | Which content is getting cited | What to write more of |
| Crawler activity | GPTBot/ChatGPT-User hits on new pages | Whether new content is being seen |
| Confirmed AI revenue MTD | Revenue joined to Stripe, month-to-date | Early read on whether it's converting |
| AI-influenced pipeline | Open opportunities with an AI touch | Pipeline forecasting |
| Top AI-cited pages by RPV | Pages driving the most AI revenue | Where to invest conversion effort |
The quarterly board report is the one-slide artifact from the worked example above, plus a backup slide that holds the leading indicators for the inevitable "how confident are you" follow-up. The cadence discipline is what keeps the board slide clean: because you have a monthly venue for the detail, you are never tempted to cram it onto the quarterly slide.
The diagram shows the information flowing up and condensing as it goes: weekly glances feed the monthly report, the monthly report's revenue signal condenses into the quarterly board slide, and the leading indicators sit in backup ready to corroborate but never lead. Each level of the hierarchy strips out the detail the level above it cannot use.
One note on board reporting norms generally: boards are trained to want defensibility and trajectory over point-in-time activity, which is exactly why the quarterly slide leads with trend and payback rather than this month's citation count[9]. You are speaking the board's native language when you report a compounding channel with an improving payback, and a foreign one when you report raw activity metrics.
Why you can only report AI search ROI if you measured it first
Everything in this article is downstream of a hard prerequisite: you cannot report AI search revenue you did not measure, and measuring it requires joining AI traffic to your payment system, which the default analytics stack does not do. This is the part where reporting meets engineering, and it is the reason so many teams are stuck reporting leading indicators — not because they prefer them, but because the leading indicators are the only thing their toolchain can see. The revenue is real; it is sitting in GA4's Direct bucket, unattributed, because the AI client stripped the referrer. To report it, you first have to recover it.
The measurement layer needs four capabilities, and the reporting layer this article describes sits directly on top of them. Without all four, there is nothing honest to put on the board slide.
| Capability | What it produces | Why reporting needs it |
|---|---|---|
| Server-side AI detection | Recovers AI sessions GA4 hides in Direct | Without it, your revenue numerator is empty |
| First-party identifier | Carries a stable ID from first visit to payment | Without it, you can't join the session to the customer |
| Idempotent Stripe webhook | Records attribution exactly once | Without it, your revenue number double-counts and dies in audit |
| Reporting layer by engine + model | Slices revenue by engine, applies attribution models | This is what produces the slide |
The first three are the measurement methodology I walk end to end in how to measure GEO ROI — the baseline, the detection, the Stripe join, the confidence range. The fourth is the reporting layer this article is about. They are sequential: you build the measurement stack, you wait for one conversion cycle, and only then do you have a defensible revenue number to translate into the CEO/CFO/board framings above. Trying to report before measuring is how you end up holding citation counts in a board meeting, which is exactly the trap Marcus was about to walk into.
This is the entire revenue wedge, and I am not going to pretend I am neutral about it. Attrifast exists because I got tired of rebuilding this exact stack by hand for my own SaaS — the server-side detection, the cookieless first-party identifier, the idempotent Stripe webhook, the reporting layer that splits revenue by AI engine and lets me apply first-touch, assisted, and last-touch models side by side. The product joins AI traffic to Stripe payments so the revenue number on your board slide is a real join, not a modeled estimate. You can build the four capabilities yourself in four to six weeks of engineering — and if you do, your numbers will be just as valid; the capabilities matter more than the vendor. But for a bootstrapped SaaS, the build cost of four to six weeks almost always exceeds a year of a $9.99/mo subscription, which is why most teams buy the layer rather than build it. Either way, the point stands: the report is only as good as the join underneath it. If you want to start narrow with just the AI-traffic detection piece before building the full revenue join, track ChatGPT traffic walks that smaller setup, and the revenue attribution feature covers the full join.
A note on the share-of-voice metric specifically, since it is the leading indicator teams most want to put on the board slide: share-of-voice is genuinely useful for understanding your competitive position in AI answers, and I cover how to measure it in AI search share of voice. But it belongs in the operational report, not the board slide, for the same reason every leading indicator does — it tells you how much AI-answer real estate you own, not how much money that real estate produced. Owning more of the answer is necessary for revenue and nowhere near sufficient. Report the SOV to yourself to steer; report the revenue to the board to decide.
Putting it together: the reporting workflow end to end
Here is the whole reporting workflow as a sequence, so the pieces connect rather than floating as separate sections. The workflow assumes the measurement layer is already built — if it is not, that is step zero, and it is the subject of the measurement methodology.
| Step | What you do | Output |
|---|---|---|
| 1. Recover the revenue | Join AI sessions to Stripe payments | Confirmed + inferred AI revenue by engine |
| 2. Choose the headline model | Pick assisted as default; compute first/last for the range | Headline number + range |
| 3. Fully load the cost | Sum content, tooling, and your time | Defensible denominator |
| 4. Compute payback | Cost / monthly AI revenue run-rate | The number the CEO compares |
| 5. Frame per stakeholder | CEO/CFO/CMO/board cuts from the same data | Four framings, one truth |
| 6. Build the one-slide board update | Six lagging-revenue rows + confirmed/inferred split | The artifact |
| 7. Write the talk track | One sentence per line, in the room's question order | The 90-second delivery |
| 8. Keep leading indicators in backup | Citations, SOV, sessions on standby | Corroboration on demand |
| 9. Run the two cadences | Monthly operational, quarterly board | Steering + deciding |
The workflow is linear the first time and continuous after that. Steps 1 through 4 produce the numbers, steps 5 through 8 produce the report, and step 9 is the rhythm you settle into. The thing that makes the whole workflow credible is that every number on the final slide traces back through step 1 to an actual Stripe payment — not a citation, not a visibility score, not a modeled estimate. That traceability is what survives the board meeting Marcus was dreading.
What happened to Marcus, by the way: he had instrumented the Stripe join three months earlier but had never pulled the revenue cut, because his vendor dashboard was so much easier to screenshot. The night before the meeting we pulled it. AI search had driven about $3,100 a month in confirmed new revenue against his roughly $2,000 fully loaded cost — a modest, real, roughly two-month payback. He rebuilt the slide around that one number, moved the citation chart to backup, and wrote the ninety-second talk track. The former-CFO investor asked the question he always asks. This time Marcus answered it in one sentence, and the program got a budget increase instead of a cut. The citations were always real. They were just never the answer to the question the room was asking.
FAQ
How do I report AI search ROI to my CEO in one sentence?
Lead with money and payback, not citations: "AI search drove an estimated $X in new revenue this quarter on $Y of cost — a Z-month payback — and it is our fastest-growing acquisition channel at 13% month-over-month." That single sentence answers the only two questions a CEO actually has — how much did it make us, and how fast does it pay back — and it deliberately omits citation counts, visibility scores, and share-of-voice because those are inputs, not return. Put the revenue number first, the cost second, the payback third, and the growth rate fourth. Everything else is backup that lives in the appendix for when the CFO asks how you got the number. If you cannot say that sentence with a real revenue figure, you do not yet have a reporting problem, you have a measurement problem — you have to join AI traffic to Stripe before you can report it.
What does my CEO actually want to see in an AI search report versus what I want to show?
You want to show effort and progress — citations climbing, visibility scores improving, new pages shipped. Your CEO wants to see outcome and efficiency — revenue attributed to the channel, cost to produce it, payback period, and whether the trend is up or down. The gap between those two is where most GEO budgets die. The fix is to demote everything you are proud of to a "leading indicators" appendix and lead the report with the three numbers a CEO can act on: AI-attributed revenue, fully loaded cost, and payback. A CEO does not allocate budget against a 9x citation lift because a citation is not a dollar. They allocate against a defensible revenue number with a payback they can compare to every other channel competing for the same dollar.
What is the difference between a leading indicator and a lagging indicator in an AI search report?
Leading indicators move early and predict revenue: AI crawler hits, citation count, citation share-of-voice, and AI-engine referral sessions. Lagging indicators are the money itself: AI-attributed revenue, revenue per visitor by engine, AI-influenced pipeline, and payback period. The reporting rule is simple and strict — leading indicators belong on your operational dashboard for steering the program week to week, and lagging indicators belong on the slide you show leadership. The single most common mistake that gets budgets cut is putting a leading indicator on the leadership slide and calling it ROI. A board does not care that you are cited more; they care whether being cited more produced cash. Report the cash; keep the citations as backup.
How do I present AI search attribution honestly without undermining my own numbers?
Under-claim, show the methodology, and separate confirmed revenue from inferred revenue into two columns. Detection misses some AI sessions, so your numerator is a floor, not a ceiling — say so explicitly, because "this is conservative, the true number is likely higher" builds credibility rather than eroding it. Present a range across attribution models (first-touch to last-touch) rather than a single point estimate, name which model your headline uses, and put the inferred bucket in its own column so a skeptical CFO can take only the confirmed number and still see a positive return. The counterintuitive truth is that honest error bars make your number more persuasive, not less, because a sophisticated finance leader trusts a ranged estimate with named assumptions far more than a suspiciously precise point number that hides its own uncertainty.
Why is AI search revenue hidden in GA4's Direct bucket, and how do I explain that to leadership?
AI clients like ChatGPT strip the referrer header on most outbound clicks, so GA4 sees no source and files the visit under Direct/(none)[4]. Across the 200-site cohort I run, a median 34% of what GA4 labels Direct is actually AI-referred traffic[13]. The way to explain this to leadership is not with the technical mechanism but with the business consequence: "GA4 is crediting a third of our Direct bucket to nothing, when it is actually revenue from ChatGPT and Perplexity — we have been under-counting our second-largest acquisition channel by roughly 64%." Frame it as a measurement gap that costs money in misallocated budget, not as a tracking bug. Leaders care that the wrong number led to the wrong decision, not about the Referrer-Policy header.
How often should I report AI search results, and to whom?
Run two cadences. A monthly operational report for yourself and your marketing leader that tracks leading indicators (citations, crawler hits, AI referral sessions) plus early revenue signals so you can steer the program. And a quarterly board or executive update that reports only lagging revenue metrics — AI-attributed revenue, payback period, channel mix, and trend — with the leading indicators relegated to an appendix. The mistake is reporting leading indicators to the board monthly, which trains them to think of AI search as an activity rather than a channel, and reporting revenue to yourself quarterly, which is too slow to course-correct. Match the metric to the cadence to the audience: fast leading metrics for operators, slow lagging metrics for leadership.
What numbers should never go on a board slide about AI search?
Never put raw citation count, visibility score, share-of-voice percentage, AI crawler hit count, or a vendor dashboard screenshot on a board slide as if it were the result. Those are all leading indicators — they tell you the machine is turning, not that it is printing money — and a competent board member will see through them in seconds and ask "where is the revenue?" If you cannot answer, the program looks like an unmeasured cost. Replace each one: instead of citation count, show AI-attributed revenue; instead of share-of-voice, show revenue per visitor by engine; instead of crawler hits, show payback period. The leading indicators can live in a backup slide for the inevitable "how confident are you in that revenue number" follow-up, but they are never the headline.
How do I prove AI search ROI to a skeptical CFO specifically?
A CFO is not skeptical of AI search; they are skeptical of attribution. Bring three things to satisfy them. First, a clean numerator — Stripe payments joined back to AI-engine sessions at the customer level, not citation counts or modeled estimates. Second, a fully loaded cost that includes labor, not just the tool subscription, because a CFO will immediately discount a cost number that ignores your time. Third, a stated confidence range with the attribution model named and the inferred bucket broken out separately. The sentence that wins a CFO is: "Here are the N customers, here is the Stripe payment for each, here is the AI-engine session that originated or assisted it, and here is the join method per customer." Specific, joined, and ranged beats big and round in front of finance every single time.
What is a realistic AI search payback period to report?
Payback is cost divided by monthly AI-attributed revenue run-rate. For a bootstrapped SaaS spending a fully loaded $1,000-$2,000 a month on a GEO program that reaches a steady-state of a few thousand dollars a month in AI-attributed new revenue, payback typically lands somewhere between three and eight months once the program matures past the initial conversion lag. The honest caveat to report alongside it is that payback is undefined in the first 90-120 days because the conversion lag means revenue trails the cost — so for an early-stage program, report the leading indicators and an expected payback, then convert to actual payback once you have a full conversion cycle of joined data. Reporting a payback period before revenue has had time to land is the fastest way to look like you do not understand your own funnel.
Should I compare AI search ROI to my other channels in the report?
Yes, but only if you measure all channels the same way, and that caveat matters enormously. The most powerful framing for leadership is AI search shown as a row in the same channel-mix table as Google organic, paid, and email, with revenue and revenue-per-visitor in comparable units. But it only works if every channel in that table was attributed with the same joined-to-Stripe methodology — comparing AI search measured by first-party revenue join against paid search measured by ad-platform self-reported conversions is apples to oranges and a sharp CFO will catch it. If your other channels are measured differently, say so and present AI search on its own terms rather than forcing a misleading comparison. A clean single-channel number beats a dirty cross-channel table.
What are the common reporting mistakes that get AI search budgets cut?
Six recur. One, reporting citations or visibility scores as if they were ROI, which makes leadership think the channel is unmeasured. Two, a suspiciously precise point estimate with no error bars, which a CFO reads as either naive or dishonest. Three, ignoring the cost side or counting only the tool subscription, which makes the ratio look fake. Four, reporting before the conversion lag has elapsed, which produces an artificially low number that anchors leadership negatively. Five, burying the revenue number under a wall of leading-indicator charts so the one number that matters never lands. Six, presenting AI search as a separate science project rather than a normal acquisition channel in the existing channel-mix report, which signals it is experimental and therefore cuttable. Each one is avoidable with discipline about what goes on the slide.
Do I need a special tool to report AI search ROI, or can I use GA4?
You cannot report AI search ROI from GA4 alone because GA4 buckets most AI referrals as Direct and its revenue join to Stripe is fragile — you would be reporting a number that is structurally close to zero for AI engines, which is worse than no number because it actively misleads. To report AI search revenue you need four capabilities: server-side AI-engine detection, a first-party identifier that survives consent and ITP, an idempotent Stripe webhook join, and a reporting layer that slices revenue by engine and applies multiple attribution models. You can build those four yourself in four to six weeks of engineering, or buy them. The reporting layer is the part this article is about; the measurement layer underneath it is covered in the companion measurement methodology. Without the measurement layer there is nothing honest to report.
How do I explain to my board why AI search is defensible and not a fad?
Defensibility for a board is about durability and trajectory, not this quarter's revenue. Three arguments hold up. First, trajectory: AI-attributed traffic in the cohort I track grew at a compounded 13.4% per month while Google organic grew at 1.1% — the channel is compounding, not plateauing[13]. Second, intent quality: AI-sourced traffic in the cohort converts at roughly 1.9x Google organic on B2B SaaS because the buyer arrives pre-informed, which means the revenue per visitor is structurally higher and likely to stay that way. Third, compounding moat: citations accrue to content that already ranks and has author authority, so an early, well-instrumented program builds a position competitors cannot quickly buy. Present those three as the defensibility case, and present the revenue number as the proof the trajectory is already paying.
What goes in a monthly AI search report versus a quarterly board report?
The monthly operational report is for steering and contains leading indicators plus early revenue: AI referral sessions by engine, citation count and share-of-voice deltas, crawler activity, AI-influenced pipeline, and confirmed AI-attributed revenue month-to-date. It is detailed, it is for you and your marketing leader, and it changes tactics. The quarterly board report is for deciding and contains only lagging outcome metrics: AI-attributed revenue, fully loaded cost, payback period, channel-mix position, and quarter-over-quarter trend, with leading indicators in an appendix. It is a single slide plus backup, it is for the CEO and board, and it decides budget. The discipline is to never let the monthly report's leading-indicator detail leak into the quarterly board slide, because detail reads as noise to a board and buries the one number that matters.
Can I report AI search ROI if my program is only two months old?
Not as a payback number yet, and forcing one will hurt you. In the first 90-120 days the cost is fully incurred but the revenue has barely started landing because of the 30-60 day content-to-payment lag, so any ratio you compute will be artificially low and will anchor leadership negatively. What you can and should report at two months is the leading indicators — citations appearing, crawler activity, AI referral sessions starting to land — framed explicitly as early signals, plus an expected payback based on the conversion behavior you are starting to see. Then convert to an actual reported payback once you have a full conversion cycle of joined Stripe data. The honest two-month report says "here is what's working upstream and here is when we'll have a revenue verdict," not a premature ROI number you'll have to walk back.
Sources
Primary sources for the claims in this article. Numbered citations in the text link to the matching entry.
- [1]Marketing analytics and proving marketing ROI — McKinsey & Company (2025).
- [2]CMO leadership, marketing measurement and accountability research — Gartner (2025).
- [3]Why The CFO Is Key To Proving Marketing's Business Value — Forrester (2021).
- [4]GA4 default channel grouping — Direct traffic and referral rules — Google Analytics Help (2026).
- [5]SaaS metrics: payback period, CAC, and board reporting — OpenView Partners (2024).
- [6]Why it has never been easier or cheaper to build a high-accuracy SaaS attribution model — ChartMogul (2025).
- [7]AI search, AI Overviews, and the state of generative search — Search Engine Land (2026).
- [8]How to Get Cited in Google AI Overviews: Own a Criterion — Backlinko (2026).
- [9]Board reporting best practices for finance leaders — CFO.com (2025).
- [10]AI citation and visibility analytics research — Profound (2026).
- [11]Webhook delivery, retries, and idempotency — Stripe Docs (2026).
- [12]Americans' use of AI chatbots and tools — Pew Research Center (2025).
- [13]AI traffic revenue benchmark 2026 — 200-site Stripe-joined cohort — Attrifast (2026).
- [14]Marketing attribution models and conversion paths — Google Analytics Help (2026).
- [15]How marketing leaders should present results to the board — Harvard Business Review (2024).
- [16]63% of Websites Receive AI Traffic (New Study of 3,000 Sites) — Ahrefs (2025).
- [17]We studied the impact of AI search on SEO traffic — Semrush (2025).
- [18]AI Search Stats 2026: Market Share, Referral, and Citation Data — SimilarWeb (2026).
- [19]Referrer-Policy header behavior — MDN Web Docs (2026).
- [20]Stripe Checkout and PaymentIntent metadata — Stripe Docs (2026).
Related reading from the Attrifast research stack
For the leading-indicator side of the picture, see AI search share of voice; for the revenue join that actually goes on the board slide, see Attrifast's revenue attribution and how to track ChatGPT traffic.