
Part of the generative engine optimization guide and AEO Hub.
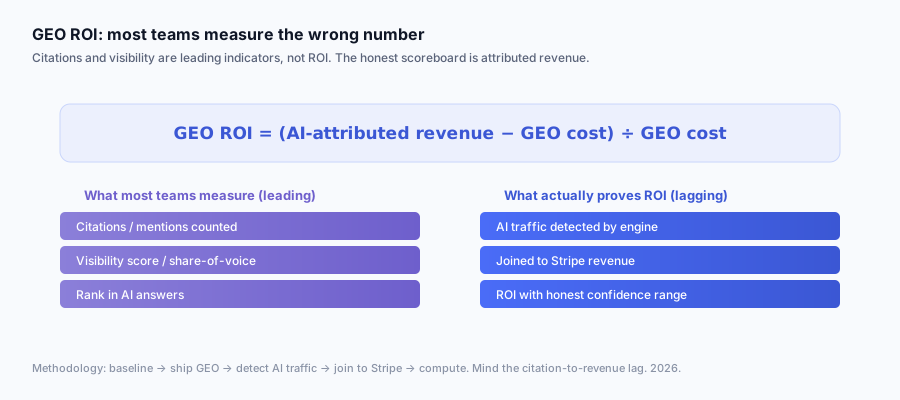
Last quarter a founder I will call Dana sat across from her board with a slide titled "GEO is working." The slide showed a 9x lift in AI-engine citations and a visibility score that had climbed from 22 to 61 on some vendor's index. Her lead investor, a former CFO, looked at it for about four seconds and asked the only question that mattered: "How much money did it make us?" Dana did not have an answer. She had spent four months and roughly eleven thousand dollars on a GEO program, and the most precise thing she could say about its return was "the citations are up." The board moved on. The program nearly got cut.
I have watched some version of that meeting happen at least a dozen times in the last year, and it is the reason I am writing this. Every GEO vendor on earth will sell you visibility. Almost none of them will honestly answer the question Dana's investor asked: how do I prove this returns money? This article is the practitioner's methodology for answering it — the full measurement loop from baseline, to shipping GEO, to detecting AI traffic engine by engine, to joining those sessions to Stripe revenue, to computing an actual return-on-investment number with confidence intervals you would not be embarrassed to show a CFO.
This is the "how to measure it" companion to a piece I wrote earlier asking does GEO actually drive revenue. That one argues GEO can pay but that proving it requires four evidence layers most teams do not have. This one assumes you have decided to find out for your own business and walks the methodology end to end. If you want the benchmark numbers I see across many sites, the AI traffic revenue benchmark has them; this article is about the math and the plumbing, not the aggregate.
Quick Facts
| Metric | Value | Source |
|---|---|---|
| GEO ROI formula | (AI-attributed revenue − GEO cost) / GEO cost | This methodology |
| Share of AI referrals GA4 buckets as Direct | Majority; commonly cited near 100% by default | Google Analytics docs [1] |
| GEO ROI driver in the original research | Citation-optimized content lifted source visibility up to ~40% | Princeton GEO paper [2] |
| AI Overviews trigger rate (Ahrefs, 146.1M SERPs, Sept 2025) | 20.5% of SERPs | Ahrefs [3] |
| Google AI Overviews click-through impact | Significant click compression on informational queries | Backlinko AI Overviews guide [4] |
| SaaS buyer journey length | Weeks to months, so single-session attribution fails | ChartMogul attribution guidance [11] |
| Typical SaaS content-to-payment lag | ~30-60 days first session to first paid | This methodology (house default) |
| Attribution window used here | ~90 days | This methodology (house default) |
| Stripe webhook delivery guarantee | At-least-once (requires idempotency) | Stripe docs [9] |
| GA4 default channel for AI referrals | Direct/(none); no built-in AI rule | Google Analytics docs [1] |
| Marketing-ROI measurement maturity gap | Most marketers cannot tie spend to revenue cleanly | McKinsey marketing analytics [6] |
| AI-engine reach (US adults using AI tools) | A large and growing share | Pew Research [12] |
| Earliest defensible GEO ROI read | ~90-120 days after first publish | This methodology |
I have spent the last six months running this exact loop across attrifast.com and a handful of client SaaS properties. Most of what follows comes from watching the measurement break in production — detection that misses the unreferred majority, first-party IDs that get reissued by a consent banner mid-funnel, Stripe webhooks that double-count under load. The formula is simple. The honesty is the hard part.
The honest GEO ROI formula — and why the numerator is the whole problem
GEO ROI is (AI-attributed revenue − GEO cost) / GEO cost. That is the entire equation, and there is no honest substitute for it. The denominator — your fully loaded cost over the period — is straightforward arithmetic you can finish in an afternoon. The numerator — revenue you can defensibly trace to an AI engine — is where every GEO ROI claim lives or dies, because it requires you to detect AI traffic that GA4 hides and join it to payments that live in Stripe.
Here is the formula broken into its parts, and where each one actually comes from.
| Term | Definition | Where you get it | Difficulty |
|---|---|---|---|
| AI-attributed revenue | Stripe revenue whose originating or assisting session came from an AI engine | Server-side detection + first-party join + Stripe webhook | Very hard |
| GEO cost | Fully loaded spend on AI-optimized content, tooling, and measurement engineering | Time tracking + invoices | Easy |
| ROI (%) | (revenue − cost) / cost × 100 | Arithmetic | Trivial |
| ROI (multiple) | revenue / cost | Arithmetic | Trivial |
| Payback period | cost / (monthly AI-attributed revenue run-rate) | Arithmetic once numerator exists | Easy |
Notice that four of the five rows are trivial or easy. The whole industry's difficulty collapses into a single cell: AI-attributed revenue. Everything else is bookkeeping. So the rest of this article is, in effect, a methodology for filling in one number honestly.
Why is the numerator so hard? Because the chain from "an AI engine cited you" to "money hit your Stripe balance" passes through several lossy steps, each of which the default analytics stack mishandles.
| Step in the chain | What should happen | What actually happens by default |
|---|---|---|
| AI engine cites your page | Citation recorded | No console reports this to you |
| User clicks the citation | Session arrives labeled "from ChatGPT" | Referrer stripped; arrives as Direct |
| Session is identified | Stable ID carried to signup | Cookie reissued by consent banner |
| User pays via Stripe | Payment tagged with source | Payment lands unattributed |
| Report shows ROI | Revenue sliced by AI engine | Revenue sits in one undifferentiated bucket |
If any one of those steps breaks, the numerator is wrong. By default, most of them break. That is the core reason GEO ROI is "broken" as an industry practice — not because GEO does not work, but because the measurement chain has multiple silent failure points and the convenient metrics (citations, visibility) sit upstream of all of them.
Why everyone measures the wrong thing
The single most common GEO measurement mistake is reporting a leading indicator as if it were return. Citations, visibility scores, and share-of-voice are upstream signals — they tell you the machine is turning, not that it is printing money. This is the same measurement-maturity gap McKinsey documents in traditional marketing, where most teams still cannot tie spend cleanly to revenue[6]. Treating a 9x citation lift as "ROI" is like a store reporting foot traffic as revenue: correlated, genuinely useful, and not the same number. The honest reframe is to demote every one of those metrics to "leading indicator" and reserve the word ROI for cash.
Here is the funnel, and the brutal arithmetic of how volume drops at each step. The exact percentages vary wildly by site; the shape is universal.
| Funnel stage | What it measures | Typical metric reported as "GEO success" | Is it revenue? |
|---|---|---|---|
| Citation | Your page appears in an AI answer | "9x more citations" | No |
| Visibility / SOV | Your share of AI answer real estate | "Visibility score 61/100" | No |
| Impression | A user sees the citation | "1300% impressions lift" | No |
| Click / session | A user clicks through to your site | "2,400 AI referral sessions" | Closer, still no |
| Conversion | A session becomes a paying customer | "$X in AI-attributed MRR" | Yes |
| ROI | Return net of cost | "(revenue − cost) / cost" | Yes — the only one |
Each row down that table sheds volume, and the sheds are large and uneven. A page can be cited heavily and clicked rarely, or cited rarely and clicked hard because it answers a high-intent query. There is no fixed conversion ratio between the rows, which is precisely why you cannot infer the bottom from the top. You have to measure the bottom directly.
Why does the industry stop at the top of the funnel? Three reasons, and none of them are stupid.
| Reason | Explanation | Honest take |
|---|---|---|
| It's measurable today | Citation and visibility tools exist; revenue join does not, off the shelf | Convenience, not correctness |
| Vendors can only see their layer | A GEO vendor controls content and citations, not your Stripe account | Structural limit, not dishonesty |
| It looks great on a slide | "9x citations" is a bigger number than "$3,200 MRR" | The number is bigger; the meaning is smaller |
I want to be fair to the vendors here. A GEO tool genuinely cannot see your Stripe balance — the revenue join is structurally the customer's problem. The mistake is not the vendor reporting citations; it is the customer accepting citations as the answer to "did it pay." The discipline is to keep using the leading indicators for what they are good at — steering the program week to week — while refusing to call them ROI.
The diagram makes the failure visible. Everything above the diamond is a leading indicator and is measurable with off-the-shelf tools. The diamond is the detection-and-join step almost nobody plumbs. Below it is the only thing that is actually ROI. Most programs live entirely above the diamond and report it as the whole story.
The five-step GEO ROI measurement methodology
Measuring GEO ROI honestly is a five-step loop: establish a baseline, ship the GEO changes, detect AI traffic engine by engine, join those sessions to Stripe revenue, and compute ROI with a confidence range. Skip the baseline and you cannot prove causation. Skip the detection and your numerator is empty. Skip the confidence range and your number is theater. The steps are sequential the first time and continuous after that.
Here is the loop at a glance, with the artifact each step produces.
| Step | Goal | Key artifact | Common failure |
|---|---|---|---|
| 1. Baseline | Know your pre-GEO revenue and AI traffic | Baseline snapshot table | Starting GEO before measuring "before" |
| 2. Ship GEO | Make changes you can attribute | Dated changelog of GEO actions | No clear ship date to anchor lift |
| 3. Detect AI traffic | Recover AI sessions GA4 hides | Sessions tagged by engine | Missing the unreferred majority |
| 4. Join to revenue | Tie sessions to Stripe payments | Customer rows with AI-engine source | Non-idempotent webhook, broken ID |
| 5. Compute ROI | Net revenue over cost, with a range | ROI range + attribution comparison | Point estimate, no caveats |
The loop refreshes. The first pass takes a quarter because you are building the stack while you wait for the conversion lag. After that, steps 3 through 5 run continuously and you re-baseline each quarter to catch drift. Now let me walk each step with the detail that makes it real.
Step 1 — Establish the baseline before you change anything
A GEO ROI number is meaningless without a "before." The baseline is the snapshot you take of revenue, traffic, and AI presence in the 30-90 days before you ship a single GEO change, and it is the thing that lets you later claim a lift was caused by GEO rather than by seasonality, a pricing change, or a lucky press mention. The most common methodology failure I see is teams who started optimizing months ago, never recorded a baseline, and now cannot separate GEO's effect from everything else.
Record these baseline metrics. Capture them as a frozen snapshot — a dated table you will not edit — so the comparison later is clean.
| Baseline metric | Why it matters | Where to get it |
|---|---|---|
| Monthly revenue (total) | The denominator for "what share is AI" | Stripe |
| New MRR / new customers per month | Isolates new business from expansion | Stripe |
| Direct/(none) session volume | AI referrals inflate this; track the "before" | GA4 |
| Organic search sessions | Separates GEO lift from SEO lift | GA4 + Search Console |
| Known AI-engine referral sessions | The referrer-passing slice you can already see | GA4 custom channel or server logs |
| AI crawler hits (GPTBot, etc.) | Leading indicator of future citations | Server logs |
| Citation count / visibility score | Your starting position in AI answers | Citation tracker or manual prompts |
| Branded search volume | AI discovery often shows up here first | Search Console |
A baseline is not one number; it is a small dashboard you freeze in time. Here is what a real baseline snapshot table looks like for a small SaaS — illustrative figures, not a specific customer.
| Metric | Baseline (90-day avg, monthly) |
|---|---|
| Total revenue | $42,000 |
| New MRR | $3,100 |
| New customers | 31 |
| Direct/(none) sessions | 4,800 |
| Organic search sessions | 9,200 |
| Known AI referral sessions | 140 |
| AI crawler hits | 320 |
| Tracked citations | 6 |
| Branded search clicks | 510 |
The honest caveat: a baseline does not give you a true control group. The cleanest causal design is a holdout — optimize half your pages and leave half alone — but for a small site you rarely have enough pages to split without starving the test. So most practitioners run a before-after design and accept that they cannot fully rule out confounders. Name that limitation in the report. It is far more credible than pretending the lift is purely causal. For the cost side, capture your starting spend too, because that is the denominator you will track.
| Cost input (baseline period) | Monthly |
|---|---|
| Content production (AI-optimized share) | $900 |
| GEO / citation tracking tooling | $150 |
| Measurement engineering (amortized) | $400 |
| Total fully loaded GEO cost | $1,450 |
Step 2 — Ship GEO with a dated changelog so lift is attributable
You cannot attribute a lift to a change you did not date. Step two is to ship your GEO actions and record each one with a date, so that when revenue moves you can line it up against what you did and when. The tactics themselves are covered in the GEO tactics playbook; the measurement requirement is narrower — every change gets a timestamp and a one-line description in a changelog you keep.
The original Princeton GEO research by Aggarwal and colleagues found that specific content moves — adding citations, statistics, and quotations — lifted source visibility in generative engines by a meaningful margin, up to roughly 40% on some query classes[2]. That gives you a menu of changes whose effect is plausibly measurable. Date each one.
| GEO action | Ship date | Expected leading-indicator effect | Time-to-signal |
|---|---|---|---|
| Add quotable 40-80 word answer under each H2 | 2026-02-03 | Higher citation rate | 2-6 weeks |
| Add statistics + sources to key pages | 2026-02-10 | Higher visibility per Princeton finding | 2-6 weeks |
| Add FAQPage + Article schema | 2026-02-12 | Better AI parsing | 2-4 weeks |
| Add author identity with sameAs | 2026-02-14 | Trust / E-E-A-T signal | 4-12 weeks |
| Publish 6 question-shaped articles | 2026-02-03 to 03-15 | More citation surface | 4-8 weeks |
The reason the dated changelog matters: AI-attributed revenue will show up weeks after the change, and without the dates you will be guessing which change drove it. With the dates, you can build a simple event-study view — overlay the changelog markers on the AI-attributed revenue line and look for lift that follows the changes with a plausible lag.
| Changelog discipline | Why |
|---|---|
| One row per discrete change | Isolates effects |
| Date everything | Enables lag analysis |
| Note the page(s) affected | Lets you slice revenue by changed vs unchanged |
| Keep it public or in version control | Audit trail = credibility |
One more honest note: do not ship ten changes in one week and then claim to know which one worked. If isolating individual tactics matters to you, stagger them. If you only care about whether the program worked, batch them and measure the program's aggregate lift — just be clear in the report which you are claiming.
Step 3 — Detect AI traffic engine by engine
The numerator is empty until you can see AI traffic, and seeing it is a two-layer problem. The cheap layer is matching the referrer and User-Agent against a known AI-engine list — the bot identifiers OpenAI[14] and other engines publish — which catches every session that passes a referrer or a labeled bot. The hard layer is the unreferred majority — humans who clicked an AI citation but arrived with the referrer stripped — which you can only infer with heuristics and must label as "suspected" rather than "confirmed." Honesty about that split is what separates a real measurement from a fabricated one.
GA4 will not do this for you. Its default channel grouping has no rule for AI engines, so the referrer-passing minority lands in Referral unlabeled and the stripped majority lands in Direct/(none), per Google's own documentation[1]. The mechanism is the Referrer-Policy header that AI clients send to blank the referrer before the hit ever reaches GA4[15]. The full mechanics of why AI traffic disappears into Direct are in dark AI traffic in GA4; here is the detection logic in summary.
| Detection signal | Catches | Confidence | Layer |
|---|---|---|---|
| Referrer matches chatgpt.com / chat.openai.com | ChatGPT web/app referrer-passing visits | High | Cheap |
| Referrer matches perplexity.ai | Perplexity visits (often passes referrer) | High | Cheap |
| Referrer matches claude.ai | Claude visits | High | Cheap |
| Referrer matches gemini.google.com | Gemini visits | High | Cheap |
| Referrer matches copilot.microsoft.com | Copilot visits | High | Cheap |
| User-Agent = ChatGPT-User / OAI-SearchBot | Live-browse fetches | High | Cheap |
| No referrer + deep long-tail entry + no UTM | Suspected AI human click | Inferred | Hard |
Here is the rule table in pseudocode — fenced, so the angle brackets are safe.
function classifyAiSource(req):
  ref = lower(req.referer)
  ua  = req.userAgent

  if contains(ua, "OAI-SearchBot"):        return "chatgpt-search"
  if contains(ua, "ChatGPT-User"):          return "chatgpt-browse"
  if contains(ua, "PerplexityBot"):         return "perplexity-bot"

  if contains(ref, "chat.openai.com")
     or contains(ref, "chatgpt.com"):       return "chatgpt"
  if contains(ref, "perplexity.ai"):        return "perplexity"
  if contains(ref, "claude.ai"):            return "claude"
  if contains(ref, "gemini.google.com"):    return "gemini"
  if contains(ref, "copilot.microsoft.com"):return "copilot"

  if ref == "" and isLongTailBlog(req.path) and not hasUtm(req):
     return "suspected-ai"   // label honestly, do not assert

  return "other"
Perplexity tends to pass a referrer more reliably than ChatGPT, which strips it on most outbound clicks[20], so your confirmed-versus-suspected ratio will differ by engine. That reliability makes Perplexity the cheapest engine to get right first, and the Perplexity traffic tracking setup is the referrer-and-user-agent configuration for doing it. Track the split per engine and report it. A practitioner-honest detection summary looks like this — illustrative shares, not a universal constant.
| Engine | Confirmed (referrer/UA) | Suspected (heuristic) | Notes |
|---|---|---|---|
| ChatGPT | ~20-30% of its sessions | ~70-80% | Referrer stripped on most app clicks |
| Perplexity | ~70-85% | ~15-30% | Passes referrer more often |
| Gemini | ~40-60% | ~40-60% | Mixed; AI Overviews differ from Gemini app |
| Claude | ~50-70% | ~30-50% | Referrer present on direct clicks |
| Copilot | ~50-70% | ~30-50% | Bing-adjacent, often labeled |
The thing to internalize: you will never recover 100% of AI sessions. The best heuristic stacks I have tested recover most of the suspected pool, not all of it. That means your numerator is a floor, not a ceiling — which is actually good news for credibility, because it means your reported ROI is conservative. Say so in the report.
Step 4 — Join AI sessions to Stripe revenue
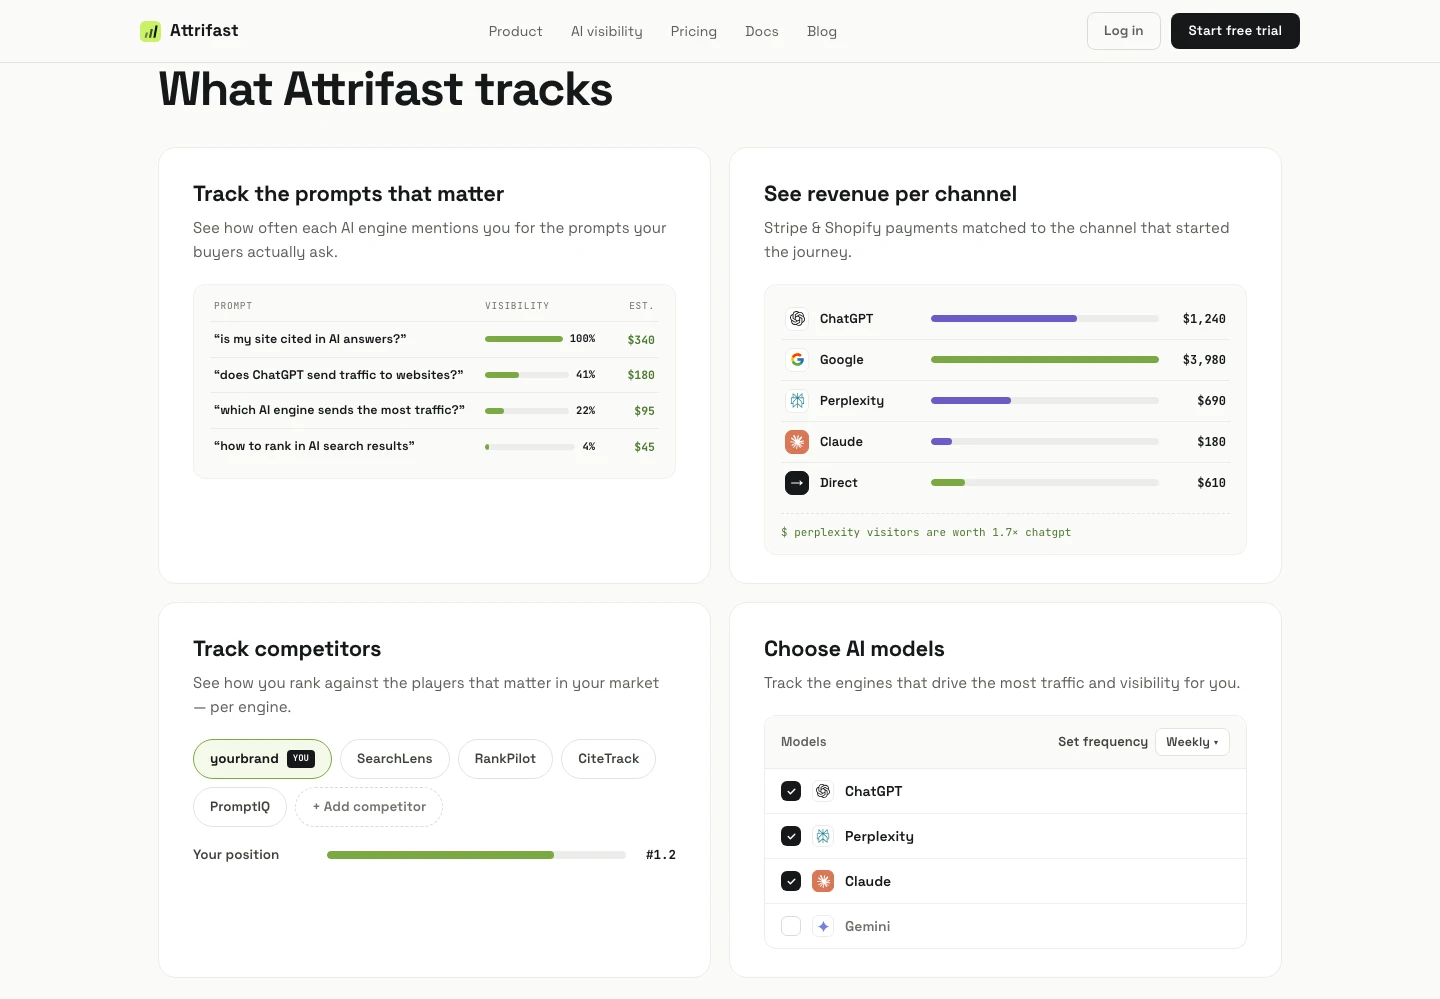
Detection tells you a session came from an AI engine; the join tells you it paid. Step four carries a first-party identifier from that first AI-referred session all the way through signup and into the Stripe payment event — written into Checkout or PaymentIntent metadata[10] — then reads the source back at payment time and writes it idempotently. This is the step that turns "2,400 AI sessions" into "these 19 customers paid us, and their first or assisting session came from an AI engine." Reported out, the join gives every engine its own revenue line rather than one undifferentiated AI bucket:
Three pieces have to work together, and each fails in a characteristic way.
| Piece | Job | Characteristic failure |
|---|---|---|
| First-party identifier | Carry a stable ID from first visit to payment | Reissued by consent banner mid-funnel; join breaks |
| Stripe metadata write | Stamp the AI source onto the payment | Metadata length cap drops the source |
| Idempotent webhook | Record attribution exactly once | At-least-once delivery double-counts |
On the identifier: a client-side third-party cookie will not survive ITP[22] or a consent banner, which is exactly how I lost 30%+ of paid-search attribution overnight years ago. The durable approach is a first-party, same-domain identifier written server-side and scoped narrowly enough to fall under audience-measurement exemptions in most jurisdictions. The mechanics of carrying that through to a Stripe Checkout are in AI-influenced conversions explained and the product side at revenue attribution.
On the webhook: Stripe delivers at-least-once, not exactly-once, per their docs[9]. Use the Stripe event ID as the idempotency key, write the attribution once, and short-circuit duplicates. I once had to retrofit this on a client whose attribution report showed channel revenue 1.7x what Stripe's own revenue report showed — a non-idempotent handler doubling about 40% of events under load.
Here is the join logic in pseudocode.
on stripe_webhook(event):
  if seen(event.id):  return            // idempotency: skip duplicates
  mark_seen(event.id)

  if event.type in ["checkout.session.completed",
                    "customer.subscription.created"]:
    customer = event.data.customer
    src = readMetadata(customer, "ai_source")   // written at checkout
    if src is null:
      src = lookupFirstTouch(customer.firstPartyId)  // fallback join
    writeAttribution(customer.id, src, event.amount)  // once
Once the join works, you can produce the row that actually answers the board's question. An anonymized cohort table looks like this.
| Customer | First-touch source | Assisting source | First payment | MRR | Join method |
|---|---|---|---|---|---|
| c_2841 | chatgpt | chatgpt | $290 | $29 | Metadata |
| c_2902 | perplexity | branded search | $99 | $99 | First-touch fallback |
| c_2933 | suspected-ai | direct | $290 | $29 | Heuristic, flagged |
| c_3001 | gemini | gemini | $49 | $49 | Metadata |
| c_3044 | claude | direct | $190 | $19 | First-touch fallback |
Notice the third row is flagged as heuristic. That is the honesty tax: when the originating session was a suspected-AI inference rather than a confirmed referrer, the resulting revenue should be reported in a separate "inferred" bucket so the reader can choose to include or exclude it. Confirmed and inferred revenue are different evidentiary classes; keep them distinct.
Step 5 — Compute ROI with an honest confidence range
The final step is arithmetic plus humility. You sum AI-attributed revenue, subtract fully loaded GEO cost, divide by cost, and — this is the part that separates credible from cosmetic — you report it as a range across attribution models rather than a single point estimate. A number like "312% ROI" hides the fact that the numerator depends on which sessions you counted, how you handled the inferred bucket, and which attribution model you chose. A range like "180% to 360%, central estimate 260%" is the honest version.
Start by computing the numerator three ways, because the attribution model changes the answer materially.
| Attribution model | What it credits to AI | Effect on GEO ROI | When to lead with it |
|---|---|---|---|
| First-touch | Full revenue if AI was the first session | Flatters GEO (AI is often discovery) | Discovery-heavy categories |
| Last-touch | Full revenue only if AI was the closing session | Undercounts GEO (buyers return via branded/direct) | Conservative floor |
| Assisted / position-based | Partial credit when AI was any touch | Fairest single view | Default for GEO |
Run the same cohort through all three and you get a spread, not a point. Illustrative monthly numbers built on the earlier baseline:
| Model | AI-attributed revenue (confirmed) | + Inferred bucket | GEO cost | ROI (confirmed only) | ROI (incl. inferred) |
|---|---|---|---|---|---|
| First-touch | $5,200 | +$1,400 | $1,450 | 259% | 355% |
| Assisted | $3,800 | +$1,000 | $1,450 | 162% | 231% |
| Last-touch | $2,600 | +$700 | $1,450 | 79% | 128% |
Read that table the way a CFO would. The defensible floor is the last-touch, confirmed-only cell: 79%. The optimistic ceiling is first-touch including inferred: 355%. The honest headline is the assisted, confirmed-only number with the inferred bucket disclosed: roughly 162%, with a stated range of 79% to 355% depending on model and inclusion. That is a sentence you can defend under questioning.
Now layer in measurement uncertainty on top of model uncertainty. Two sources of error compound.
| Uncertainty source | Direction | How to express it |
|---|---|---|
| Detection misses some AI sessions | Numerator too low | "Conservative; true number is higher" |
| Inferred sessions may not be AI | Numerator too high if included | Separate inferred bucket |
| Attribution model choice | Both directions | Report all three models |
| Conversion lag not fully elapsed | Numerator too low early | Wait for one full cycle |
The cleanest way to present all of this is a single ROI statement with the assumptions named, plus the supporting tables. Something like: "Over the 90-day window, GEO returned an estimated 162% on a fully loaded cost of $1,450/month, using an assisted-attribution model on confirmed AI sessions only. The range across first-touch to last-touch models is 79% to 259%; including heuristically inferred AI sessions raises the central estimate to roughly 231%. Detection is conservative, so the true return is likely at or above these figures." Run your own numbers through the marketing ROI calculator if you want a quick sanity check on the arithmetic before you build the full join.
Leading vs lagging indicators — and the lag between them
The deepest measurement mistake in GEO is confusing the indicators that move early with the ones that move late. Leading indicators — crawler hits, citations, visibility, AI referral sessions — predict revenue and move within weeks. Lagging indicators — AI-attributed revenue, new MRR, ROI — are the money itself and trail by the normal content-to-payment lag. Watch the leading ones weekly to steer the program; compute the lagging ones quarterly to decide its fate. Reporting a leading indicator as if it were a lagging one is the original sin.
Here is the full split, with realistic time-to-move.
| Indicator | Type | Typical time-to-move | Use for |
|---|---|---|---|
| AI crawler hits (GPTBot, etc.) | Leading | 1-3 weeks | Earliest sign content is seen |
| Citation count | Leading | 2-6 weeks | Confirming GEO inputs work |
| Citation share-of-voice | Leading | 4-8 weeks | Competitive position |
| AI referral sessions | Leading | 4-8 weeks | Traffic is actually landing |
| Assisted conversions touching AI | Leading-ish | 6-10 weeks | Pipeline forming |
| AI-attributed first-touch revenue | Lagging | 8-16 weeks | Discovery value |
| New MRR traced to AI | Lagging | 8-16 weeks | The real verdict |
| GEO ROI | Lagging | 12-20 weeks | The board number |
The lag between leading and lagging is not a bug to engineer away; it is the conversion cycle, and pretending it does not exist is how teams either kill working programs too early or declare victory too soon. A practitioner-honest timeline looks like this.
| Week | What you should see if GEO is working |
|---|---|
| 1-3 | Crawler activity rises on new pages |
| 2-6 | First citations appear in AI answers |
| 4-8 | AI referral sessions become detectable |
| 6-10 | First AI-touched conversions enter pipeline |
| 8-16 | First AI-attributed Stripe payments land |
| 12-20 | Enough data to compute a defensible ROI range |
The decision rule I run with: at day 90-120, leading indicators should be clearly positive and lagging revenue should be readable for at least the early cohort. If leading is flat, the program is not working and the lag will not save it — kill it. If leading is up but lagging is still thin, that is expected; extend the window and keep the join running. The mistake in both directions is reading the wrong indicator at the wrong time.
The measurement stack — build, buy, or hybrid
You cannot measure GEO ROI with a dashboard you already own; you need a stack with four capabilities, and you can build it, buy it, or do both. The four capabilities are server-side AI detection, a durable first-party identifier, an idempotent Stripe join, and a reporting layer that slices revenue by engine and applies multiple attribution models. Missing any one of the four and you are back to reporting leading indicators.
| Capability | What it does | Build cost | Buy option |
|---|---|---|---|
| Server-side AI detection | Recovers AI sessions GA4 hides | 1-2 weeks eng | Attrifast / first-party analytics |
| First-party identifier | Survives ITP + consent, carries to payment | 1 week eng | Same |
| Idempotent Stripe webhook | Records attribution exactly once | 3-5 days eng | Same |
| Revenue reporting by engine | Slice + apply attribution models | 1-2 weeks eng | Same |
Here is the honest build-vs-buy comparison, because the answer depends on your team.
| Dimension | Build it yourself | Buy a tool |
|---|---|---|
| Up-front cost | 4-6 weeks engineering | Subscription (~$9.99/mo for Attrifast) |
| Maintenance | Yours forever (engine list drifts) | Vendor's problem |
| Customization | Total | Bounded by the product |
| Time to first ROI read | Slower (build then wait) | Faster (wait only) |
| Best for | Teams with spare eng + unusual needs | Most bootstrapped SaaS |
For a typical bootstrapped SaaS, the build cost of 4-6 weeks of engineering time almost always exceeds a year of a $9.99/mo subscription, so the buy decision is usually obvious on cost alone. The exception is teams with genuinely unusual data needs or spare engineering capacity. I am obviously not neutral here — Attrifast exists precisely because I got tired of rebuilding this stack by hand — so weigh that. The capabilities matter more than the vendor; if you build your own and get all four working, your numbers will be just as valid.
A note on tooling categories so you can assemble the rest of the picture.
| Tool category | Examples (named for verifiability) | What it covers | Layer |
|---|---|---|---|
| Citation / visibility tracking | Profound, manual prompt checks | Leading indicators | Upstream |
| Traditional SEO + impressions | Ahrefs, Semrush, Search Console | Organic baseline, branded search | Adjacent [5][7] |
| Audience research | SparkToro | Where your audience actually is | Context [8] |
| First-party revenue attribution | Attrifast | Detection + join + ROI | The numerator |
| Payment source of truth | Stripe | Revenue events | Foundation [9] |
| General analytics | GA4 | Leading-indicator dashboard | Partial [10] |
The point of the table: no single tool does all of it, and the citation trackers — the ones most teams start with — sit entirely in the leading-indicator column. They are good tools for what they do. They just do not touch the numerator.
A worked example, end to end
Let me put the whole methodology together on one illustrative SaaS so the loop is concrete rather than abstract. The figures are constructed to be realistic, not drawn from a single named customer, and they deliberately show a modest positive ROI rather than a flashy one — because modest-and-honest is the credible register for this topic.
Baseline (Step 1): $42,000/mo revenue, 31 new customers/mo, 140 known AI referral sessions/mo, 6 tracked citations, $1,450/mo fully loaded GEO cost.
Ship (Step 2): Over six weeks, added quotable answers under H2s, statistics and sources, FAQ and Article schema, author identity, and six question-shaped articles — all dated in a changelog.
Detect (Step 3): By week 8, AI referral sessions rose from 140 to 610/mo. Of those, 380 confirmed by referrer/UA, 230 suspected-AI by heuristic.
Join (Step 4): Of the confirmed AI sessions over the 90-day window, 19 became paying customers; 7 more came from the inferred bucket (flagged separately).
Compute (Step 5): Confirmed AI-attributed new revenue ~$3,800/mo (assisted model); inferred adds ~$1,000/mo. Cost $1,450/mo.
| Stage | Before | After (steady state) | Delta |
|---|---|---|---|
| AI referral sessions/mo | 140 | 610 | +470 |
| Confirmed AI customers (90d) | — | 19 | — |
| Inferred AI customers (90d) | — | 7 (flagged) | — |
| AI-attributed new revenue/mo (assisted, confirmed) | ~$900 | ~$3,800 | +$2,900 |
| GEO cost/mo | $1,450 | $1,450 | 0 |
| ROI view | Calculation | Result |
|---|---|---|
| Assisted, confirmed only | (3,800 − 1,450) / 1,450 | 162% |
| Assisted, incl. inferred | (4,800 − 1,450) / 1,450 | 231% |
| Last-touch, confirmed only | (2,600 − 1,450) / 1,450 | 79% |
| First-touch, confirmed only | (5,200 − 1,450) / 1,450 | 259% |
The honest headline: "GEO returned roughly 162% in the 90-day window on an assisted-attribution, confirmed-sessions-only basis, with a defensible range of 79% to 259% across attribution models. Detection is conservative, so the true figure is likely at or above this." That sentence has a number, a model, a range, and a caveat. It is the version that survives the board meeting Dana lost.
Honest limitations of GEO ROI measurement
No GEO ROI number is perfect, and the credible move is to say so out loud. The methodology in this article gets you from "we have no idea" to "here is a defensible range," but it does not get you to laboratory certainty, and anyone selling you certainty in this space is selling you something. Here are the limitations I would disclose in any report.
| Limitation | Why it matters | Mitigation |
|---|---|---|
| No clean control group | Before-after can't fully rule out confounders | Holdout pages where possible; name the limitation |
| Unreferred AI sessions are inferred | Some "AI" revenue may be misattributed | Separate inferred bucket; report both |
| Detection misses some sessions | Numerator is a floor | State that ROI is conservative |
| Attribution model changes the answer | One number is misleading | Always report a range |
| Conversion lag not fully elapsed | Early reads understate revenue | Wait one full cycle |
| Engine behavior drifts | Referrer policies change over time | Re-baseline quarterly |
| Small-n volatility | Few customers = wide error bars | Report n; widen the range |
The hardest of these is the lack of a control group. The gold-standard causal design is a randomized holdout, and most small sites simply do not have enough comparable pages to split without poisoning the test. I would rather a practitioner say "this is a before-after estimate with named confounders" than fabricate a control they do not have. The second-hardest is the inferred bucket — the unreferred AI sessions you can only guess at. Keeping confirmed and inferred revenue in separate columns is the single highest-leverage honesty move in the whole methodology, because it lets a skeptical reader take the conservative number and still see a positive return.
One more thing this methodology does not do: it does not tell you GEO's ROI relative to your other channels in a way that settles budget fights. For that you would run the same join across every channel and compare, which is a bigger project. This article measures GEO's own return; the cross-channel comparison is the next layer up. If you want to start with the AI-traffic detection piece in isolation before building the full revenue join, track ChatGPT traffic walks that narrower setup.
FAQ
What is the correct formula for measuring GEO ROI?
GEO ROI is (AI-attributed revenue − GEO cost) / GEO cost, expressed as a percentage or a multiple. The denominator is easy — sum your content, tooling, and engineering hours over the period. The numerator is the entire problem. AI-attributed revenue means Stripe payments whose originating or assisting session came from an AI engine, which GA4 cannot tell you because it buckets most AI referrals as Direct. You measure the numerator by detecting AI traffic server-side, carrying a first-party identifier through to signup and payment, and joining the Stripe payment back to the AI-engine source idempotently. Everything else — citation counts, visibility scores, share-of-voice — is a leading indicator, not ROI.
Why is measuring GEO ROI so much harder than measuring SEO ROI?
Three structural reasons. First, the referrer vanishes: ChatGPT, Claude, and Gemini strip or obscure the Referer header, so the session that should read "from chatgpt.com" arrives looking like Direct traffic. Second, there is no Search Console equivalent for AI engines — you cannot pull impressions, clicks, and positions from one authoritative console the way you can for Google. Third, the conversion lag is longer and noisier because AI answers often deliver mid-funnel research traffic, not bottom-funnel ready-to-buy clicks. SEO had two decades to build measurement conventions. GEO has had about 18 months, and most of the plumbing is still do-it-yourself.
Is GEO worth it if I can't measure the revenue yet?
Usually yes, with eyes open. The inputs of a GEO program overlap roughly 80% with good SEO — question-shaped headings, schema markup, author identity, clear quotable answers — so the marginal cost over what you should already be doing is small. The honest play is to run the program while you build the measurement stack in parallel, track leading indicators (citations, AI-engine referral sessions, branded search) for the first 60-90 days, and reserve the revenue verdict for when you have a clean Stripe join and at least one full conversion cycle of data. Running GEO blind for a year is a worse bet than running it instrumented for a quarter.
How long does it take to see GEO ROI?
Across the SaaS sites I have instrumented, leading indicators move first — AI crawler activity within 1-3 weeks of publishing, the first citations within 2-6 weeks, and detectable AI-engine referral sessions within 4-8 weeks. Lagging revenue trails those by the normal content-to-payment lag, which for bootstrapped SaaS clusters at 30-60 days from first session to first paid conversion, inside the ~90-day attribution window most SaaS teams use[11]. Realistically, the earliest you should expect a defensible GEO ROI number is about 90-120 days after you start publishing, and you should not trust a single month — you want at least one full conversion cycle plus a buffer for measurement noise before you compute a ratio you would show a board.
Can GA4 measure GEO ROI on its own?
No. GA4's default channel grouping has no rule for AI engines, so most AI-referred sessions land in Direct/(none), per Google's own channel-grouping documentation. You can build a custom channel group with regex rules for the AI-engine referrer domains, which recovers the minority of sessions that pass a referrer, but it cannot recover the majority that arrive with the referrer stripped, and GA4's revenue join to Stripe is fragile because GA4 attributes on last-click within a cookie window that consent banners and ITP routinely break. GA4 is a useful leading-indicator dashboard for the referrer-passing slice. It is not a GEO ROI engine. The revenue numerator needs server-side first-party detection plus a Stripe webhook join.
What's the difference between leading and lagging GEO indicators?
Leading indicators move early and predict revenue: AI crawler hits, citation count, citation share-of-voice, AI-engine referral sessions, and assisted-conversion touches. Lagging indicators are the money itself: AI-attributed first-touch revenue, AI-assisted revenue, new MRR traced to an AI source, and ultimately ROI. The trap is treating a leading indicator as if it were the lagging one — reporting a citation count or a visibility score and calling it ROI. Leading indicators tell you the machine is turning; only the lagging ones tell you it is printing money. Watch the leading ones weekly to steer; compute the lagging ones quarterly to decide.
How do I detect which AI engine sent a visitor?
Two layers. The cheap layer is server-side referrer matching against a known AI-engine domain list — chatgpt.com, chat.openai.com, perplexity.ai, claude.ai, gemini.google.com, copilot.microsoft.com — plus User-Agent matching for the live-browse bots like ChatGPT-User, PerplexityBot, and OAI-SearchBot. That catches everything that passes a referrer or a labeled agent. The harder layer is the unreferred majority: humans who clicked an AI citation but arrived with no referrer. For those you fall back to heuristics — deep-page entries on long-tail content with no UTM, clustered timing, and entry patterns that match citation-driven behavior — and you label them as suspected AI rather than asserting certainty. Be honest in the data about which sessions are confirmed versus inferred.
Should I include confidence intervals in a GEO ROI report?
Yes, and refusing to is the single biggest credibility mistake I see. The numerator of GEO ROI is built on detection that is partial (you miss some AI sessions), inference that is probabilistic (you label some sessions as suspected), and attribution that is model-dependent (first-touch versus last-touch versus assisted gives different numbers). A point estimate like "312% ROI" hides all of that. A range — "180% to 360% ROI depending on attribution model, with the central estimate at 260%" — is honest and far more defensible in front of a skeptical CFO. Report the range, name the assumptions, and show how the number moves when you change the attribution model.
What attribution model should I use for GEO?
Run at least two and report both. First-touch credits the AI engine for discovery, which flatters GEO because AI answers are often the first time a buyer encounters you. Last-touch credits whatever channel closed the deal, which usually undercounts GEO because the buyer often returns via branded search or direct before paying. The truth sits between them, which is why a position-based or assisted model — counting AI as an influencing touch even when it is not first or last — is the fairest single view for GEO. The discipline is to never report one number; report first-touch, last-touch, and assisted side by side so the reader sees the spread.
How much should GEO cost, and what counts as the cost input?
The denominator should include everything you would not have spent otherwise: content production hours specific to AI optimization, any GEO or citation-tracking tooling subscription, the engineering time to build or buy the measurement stack, and a fair share of the writer or agency cost allocated to AI-targeted pieces. For a bootstrapped SaaS doing GEO in-house, I typically see real monthly cost between a few hundred and a couple thousand dollars once you fully load the time. The mistake is counting only the tool subscription and ignoring the labor, which makes the ROI look artificially huge. Load the cost honestly or the ratio is theater.
Can I prove GEO ROI to a skeptical board or investor?
You can prove it defensibly if you bring three things: a clean numerator (Stripe payments joined to AI-engine sessions, not citation counts), an honest denominator (fully loaded cost), and a stated confidence range with the attribution model named. What does not survive a sharp board is a visibility score, a share-of-voice percentage, or a vendor dashboard screenshot — those are inputs, and any competent CFO will ask "where is the revenue?" The strongest move is to show a cohort: "these N customers paid us this much, their first or assisting session came from an AI engine, here is the join, and here is the ROI range." Specific, joined, and ranged beats big and round every time.
What is the minimum stack to measure GEO ROI?
Four pieces. One, server-side AI-engine detection so referrals do not vanish into Direct. Two, a first-party identifier scoped to your own domain that survives consent banners and ITP and carries from first visit through signup. Three, a Stripe webhook handler that reads the attribution metadata at payment time and writes it idempotently. Four, a reporting layer that lets you slice revenue by AI engine and apply different attribution models. With those four you can compute a real GEO ROI number. Without all four you are reporting a leading indicator and calling it ROI. This is the architecture Attrifast ships.
Why do most GEO ROI claims fall apart under scrutiny?
Because they measure the wrong thing. The industry default is to report citations, visibility scores, or share-of-voice — all leading indicators — and present them as if they were return. They are not. A 1300% impressions lift is real and useful, but impressions are not clicks, clicks are not sessions, and sessions are not paying customers. Each step down that funnel drops volume, and the drops are large and uneven. A GEO ROI claim falls apart the moment someone asks "show me the Stripe payments," because most claims never traversed the funnel from citation to cash. The fix is to measure the numerator that actually appears on your bank statement.
Is a high citation count a good proxy for GEO ROI?
No, it is a leading indicator at best. Citation count tells you AI engines are surfacing your content, which is necessary for revenue but nowhere near sufficient. A page can be cited heavily for a low-intent informational query and convert almost nobody, while a single citation on a high-intent comparison query drives real customers. Because there is no fixed conversion ratio between citations and customers, you cannot back into ROI from citation volume. Use citation count to confirm your GEO inputs are working and to steer which topics to double down on — then measure the actual revenue join separately. The two numbers move together loosely, not tightly.
Sources
Primary sources for the claims in this article. Numbered citations in the text link to the matching entry.
- [1]GA4 default channel grouping — Direct traffic and referral rules — Google Analytics Help (2026).
- [2]GEO: Generative Engine Optimization (Aggarwal et al.) — arXiv / Princeton (2024).
- [3]What triggers AI Overviews? 86 factors and 146 million SERPs analyzed (20.5% of SERPs, September 2025) — Ahrefs (2025).
- [4]How to Get Cited in Google AI Overviews: Own a Criterion — Backlinko (2026).
- [5]63% of Websites Receive AI Traffic (New Study of 3,000 Sites) — Ahrefs (2025).
- [6]Marketing analytics and proving marketing ROI — McKinsey & Company (2025).
- [7]We studied the impact of AI search on SEO traffic — Semrush (2025).
- [8]Where AI search audiences actually spend attention — SparkToro (2025).
- [9]Webhook delivery, retries, and idempotency — Stripe Docs (2026).
- [10]Stripe metadata limits and usage — Stripe Docs (2026).
- [11]Why it has never been easier or cheaper to build a high-accuracy SaaS attribution model — ChartMogul (2025).
- [12]Americans' use of AI chatbots and tools — Pew Research Center (2025).
- [13]AI citation and visibility analytics research — Profound (2026).
- [14]GPTBot, ChatGPT-User, and OAI-SearchBot documentation — OpenAI (2026).
- [15]Referrer-Policy header behavior — MDN Web Docs (2026).
- [16]AI crawlers and referral traffic insights — Cloudflare Radar (2026).
- [17]GA4 attribution models and conversion paths — Google Analytics Help (2026).
- [18]AEO, GEO, SEO: What's the Best Search Playbook? — CMSWire (2026).
- [19]Stripe Checkout and PaymentIntent metadata — Stripe Docs (2026).
- [20]63% of Websites Receive AI Traffic (New Study of 3,000 Sites) — Ahrefs (2025).
- [21]AI Search Stats 2026: Market Share, Referral, and Citation Data — SimilarWeb (2026).
- [22]Intelligent Tracking Prevention (ITP) overview — WebKit (2026).
Related reading from the Attrifast research stack
To dive deeper, see how Attrifast does the part that actually appears on your bank statement: revenue attribution by AI engine.