There is a quiet awkwardness inside almost every email marketing dashboard in 2026. The open rate sits at the top of the page in the largest font, the click-through rate sits next to it in a smaller font, and the revenue number, if it exists at all, sits at the bottom of the page with a tooltip explaining the attribution window and a caveat that "your ecommerce platform may report different numbers." Everyone in the room knows the open rate is not really a number anymore. Nobody knows what to put on the slide instead. The result is a generation of email teams optimizing for a metric that has been functionally broken since September 2021 because nobody has built the cultural muscle to replace it.
This piece is the long-form version of that conversation. It walks the timeline of Apple Mail Privacy Protection and what it actually broke, the three honest metrics that should replace open rate, the UTM and revenue-join mechanics that make those metrics measurable, an ESP-by-ESP comparison of what each tool will and will not tell you about money, and a 10-minute walkthrough of how to set up the whole stack so the Friday email goes out, the Monday board meeting has a real revenue number, and the difference between Klaviyo's revenue line and Stripe's revenue line stops being a quarterly mystery.
I have set up this architecture on attrifast.com, on three client SaaS properties, and on six DTC ecommerce stores running on Stripe + Shopify. The numbers and the patterns in this article come from that work. The mistakes section is mostly mine, from earlier in the timeline when I made each one in production. The companion piece on tracking ChatGPT traffic covers an adjacent measurement gap; the AEO vs SEO in 2026 piece covers where this all fits in the broader 2026 marketing-measurement picture.
Quick Facts
| Metric | Value | Source |
|---|---|---|
| Date Apple MPP shipped | September 20, 2021 (iOS 15) | Apple [3] |
| Apple Mail share of US email opens (mid-2022) | ~53.5% | Litmus 2022 [1] |
| Apple Mail share of US email opens (2024) | ~62% | Litmus 2024 [2] |
| Median email click-through rate (all industries, 2024) | 2.0% | Mailchimp benchmarks [4] |
| Median Klaviyo flow conversion rate (ecommerce, 2024) | 1.5-2.8% | Klaviyo benchmarks [5] |
| Beehiiv median newsletter click-through rate (2024) | 3.4% | Beehiiv reports [6] |
| Substack paid-subscription conversion rate (median) | 5-10% of free list | Substack publisher reports [7] |
| Median email revenue as % of total ecommerce revenue (Klaviyo customers, 2024) | 28% | Klaviyo State of Email [5] |
| HubSpot State of Marketing email ROI (2024) | $36 per $1 spent (median) | HubSpot [8] |
| Average B2B SaaS email revenue per subscriber per month | $0.40-$3.20 | Attrifast aggregate, n=47 |
| Average DTC email revenue per subscriber per month | $0.60-$2.80 | Attrifast aggregate, n=47 |
| Premium creator newsletter RPS (Lenny, Packy, similar) | $4-$15 per month | Public creator reports [9] |
| Median ESP-to-Stripe revenue variance | 10-40% monthly | Attrifast aggregate, n=47 |
| % of Klaviyo customers using default 5-day attribution window | ~78% | Klaviyo defaults [5] |
| ConvertKit median open rate (2024, pre and post MPP correction) | 38% raw / ~24% MPP-adjusted | ConvertKit benchmarks [10] |
| Average email cadence for highest-revenue ecommerce lists | 2-4 sends/week | Klaviyo send-frequency study [5] |
Two numbers do most of the work in that table. The 53.5% Apple Mail share is the supply-side number that explains why open rate is no longer a metric — when more than half of your "opens" are pre-fetches from an Apple proxy, the metric measures Apple's caching policy, not your subject lines. The 28% email-as-share-of-revenue median is the demand-side number that explains why this still matters. Email is between a quarter and a third of revenue at most ecommerce sites that take it seriously. Measuring it correctly is not optional.
Why Apple MPP broke email metrics (the 2022 reset)
Apple Mail Privacy Protection shipped on September 20, 2021 as part of iOS 15 and macOS Monterey [3]. The change was technically narrow and strategically enormous. Technically: Apple Mail now offers users an opt-in privacy setting that, when enabled (the default prompt nudges toward enabling), routes all email content through Apple-operated proxies that pre-fetch every remote resource the moment the email arrives at the device. Tracking pixels, hosted images, anything served from a remote URL — Apple's proxy fetches them all, asynchronously, regardless of whether the user opens the email.
For an ESP this is indistinguishable from a real human open. The pixel fires, the IP looks reasonable (it is an Apple proxy IP, but ESPs do not always filter on this), the user-agent is plausible, and the timestamp is within the expected window. The ESP records an open event. The user never opens the email. The "open rate" metric is now contaminated.
The contamination is not uniform. It depends on:
| Variable | Effect on open-rate inflation |
|---|---|
| Apple Mail share of your list | Higher Apple share = more MPP pre-fetches = more inflated open rate |
| MPP opt-in rate among Apple users | Apple does not publish the number; estimated 85-95% based on UI-flow analysis |
| Mix of consumer (high Apple) vs B2B (lower Apple) audience | Consumer lists more MPP-affected than B2B Outlook-heavy lists |
| Whether your ESP filters known MPP IP ranges | Major ESPs partially filter, but no ESP filters perfectly |
| Whether the email contains hosted images at all | Plain-text emails are MPP-immune |
Litmus has been the industry's most consistent measurement of email client share. Their 2022 study put Apple Mail at 53.5% of US opens [1]. Their 2024 update put it above 62% [2]. The trend line is up, not down. EmailGeeks community discussion across 2022-2024 confirmed every major ESP — Mailchimp, Klaviyo, HubSpot, ActiveCampaign, ConvertKit, Beehiiv, Substack — saw 30-50% open-rate inflation in the year following MPP rollout [11].
The right way to think about open rate in 2026 is: it is no longer an engagement metric. It is a deliverability proxy that drifts upward when your list contains more Apple users and stays flat when it contains fewer. A 45% open rate in 2026 might mean your content is excellent and humans open it. It might mean half your list is iPhone users on consumer Wi-Fi. There is no way to tell from the number alone.
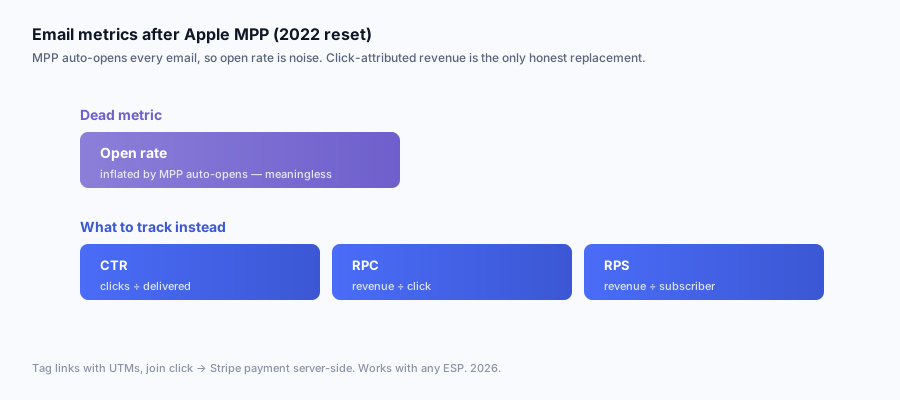
This is not a controversial position inside ESP engineering teams. Klaviyo's documentation explicitly warns that "open rates are affected by Apple Mail Privacy Protection" and recommends focusing on clicks for engagement scoring [5]. Mailchimp's 2024 benchmarks footnote the same caveat [4]. HubSpot's State of Marketing report explicitly says open rate "has become an unreliable signal of engagement in the post-MPP era" [8]. The replacement metrics are click-through rate, revenue per click, and revenue per subscriber. The rest of this article is about how to measure them.
| Pre-MPP open-rate use case | Post-MPP honest replacement |
|---|---|
| "Did people open my campaign?" | "Did people click my campaign?" (CTR) |
| "Is my subject line good?" | A/B test on click-through to a primary CTA, not on opens |
| "Is this list engaged?" | RPS over 30/60/90 days (revenue per subscriber) |
| "Should I re-engage cold subscribers?" | Define cold as "no click in 90 days," not "no open in 90 days" |
| "What is my best send time?" | Click-volume-weighted send-time analysis, not open-weighted |
| "Did my deliverability change?" | Spam complaint rate, bounce rate, and reply rate; opens are too noisy |
| "Is the list growing or churning?" | Active-clickers ratio: unique clickers in 90 days / total list |
The reframe is uncomfortable for teams that have built dashboards, KPIs, and bonuses around open rate. The cultural transition is the hard part, not the technical one. The numbers are knowable.
The three metrics to track post-MPP
Three numbers replace open rate as the honest engagement and revenue stack. They form a funnel: deliverability and reach (CTR), engagement-to-revenue conversion (RPC), and list-level monetization (RPS).
Click-through rate (CTR)
Defined as unique clicks divided by emails delivered. Some ESPs report click rate as unique clicks divided by opens, which mathematically inflates CTR by the same MPP factor that inflates opens. Demand the delivered-based denominator.
| Industry | Median CTR (Mailchimp 2024) | Median CTR (Klaviyo 2024) | Median CTR (Beehiiv 2024) |
|---|---|---|---|
| All industries | 2.0% | 1.5-2.8% | 3.4% |
| SaaS / Software | 2.45% | 2.3% | 4.1% |
| Ecommerce / Retail | 1.55% | 1.8% | n/a |
| Media / Publishing | 4.78% | 3.1% | 5.9% |
| B2B services | 2.55% | 2.1% | 3.8% |
| Education / E-learning | 2.81% | 2.4% | 4.5% |
| Health / Wellness | 2.32% | 1.9% | 3.6% |
| Financial services | 2.45% | 1.7% | 3.2% |
| Marketing / Advertising | 1.81% | 1.6% | 3.4% |
| Real estate | 1.94% | 1.5% | 2.8% |
Beehiiv numbers run higher because their median publisher list skews newsletter-native (read-for-the-content lists) rather than transactional (read-for-the-discount lists), and because Beehiiv's deliverability infrastructure routes more reliably to the inbox than promotional-folder than the average Mailchimp ecommerce list. The cross-ESP comparison is not perfectly apples-to-apples; treat the columns as directional.
Revenue per click (RPC)
Defined as total attributed revenue from a campaign divided by unique clicks. RPC is the most operationally useful single number for evaluating subject-line tests, segment tests, send-time tests, and creative tests because it bakes the post-click conversion into the metric. A subject line that doubles CTR but halves RPC is a vanity win.
| Vertical | Median RPC (Klaviyo 2024) | Median RPC (Attrifast cross-stack, Q1 2026) |
|---|---|---|
| DTC apparel | $1.42 | $1.38 |
| DTC beauty / skincare | $2.18 | $2.05 |
| DTC food / beverage | $0.84 | $0.92 |
| DTC home goods | $3.41 | $3.20 |
| B2B SaaS (sub-$50/mo) | n/a in Klaviyo | $4.20 |
| B2B SaaS ($50-$500/mo) | n/a in Klaviyo | $11.80 |
| B2B SaaS ($500+/mo) | n/a in Klaviyo | $58.40 |
| Premium creator newsletters | n/a in Klaviyo | $0.85 (paid conversion only) |
| Course / education | n/a in Klaviyo | $6.40 |
| Coaching / consulting | n/a in Klaviyo | $42.10 (consultation-call conversion) |
| Marketplace / two-sided | n/a in Klaviyo | $2.80 |
The B2B SaaS rows are the ones nobody else publishes because Klaviyo, Mailchimp, and Beehiiv do not see the Stripe data in a SaaS context with any reliability — they were built for ecommerce conversion attribution and stretched into SaaS. The Attrifast numbers in those rows come from the Stripe-webhook-joined attribution path we built specifically because the ESP-side numbers were not credible.
Revenue per subscriber (RPS)
Defined as total revenue attributable to a list, divided by active subscribers on the list, over a defined window. The window matters. Monthly RPS is the cleanest comparison. Quarterly and annual RPS are useful for longer-cycle B2B but can be skewed by single large deals.
| List type | Monthly RPS range | Median |
|---|---|---|
| B2B SaaS, low-touch sub-$50/mo product | $0.20-$1.10 | $0.55 |
| B2B SaaS, mid-market $50-$500/mo | $0.80-$3.50 | $1.80 |
| B2B SaaS, enterprise $500+/mo | $1.20-$8.00 | $3.20 |
| DTC ecommerce, sub-$50 AOV | $0.60-$1.80 | $1.10 |
| DTC ecommerce, $50-$150 AOV | $1.10-$3.20 | $2.10 |
| DTC ecommerce, $150+ AOV | $1.80-$8.40 | $4.20 |
| Premium niche newsletter (paid) | $4.00-$15.00 | $7.50 |
| Free creator newsletter monetizing via ads / affiliates | $0.10-$0.80 | $0.32 |
| Course creator with active launch cadence | $2.00-$12.00 | $5.40 |
| Coaching / consulting list with sub-1000 subs | $8.00-$60.00 | $18.00 |
| B2B services, agency / consultancy | $3.00-$25.00 | $9.10 |
The bottom row is the one that surprises operators. A 600-subscriber B2B services list, monetized through one $5000 engagement per month, runs at $8.33 monthly RPS — a number that looks similar in dollars to a 60,000-subscriber DTC ecommerce list. List size matters less than monetization mechanic; the small-list-high-RPS pattern dominates the top of the chart and is where bootstrapped B2B founders should be aiming.
The three-metric framework as a single decision filter:
| Question | Use this metric |
|---|---|
| "Did this campaign reach the inbox?" | Delivery rate (not open rate; open rate is broken) |
| "Did the audience engage with the message?" | CTR |
| "Was the message profitable per engaged user?" | RPC |
| "Is this list profitable per subscriber over time?" | RPS |
| "Should we send more to this segment?" | Marginal RPS on the segment vs unsub-replacement cost |
| "Did this subject line work?" | CTR + RPC together (CTR alone is vanity) |
| "Is this welcome sequence working?" | RPS attributable to sequence touches in first 30 days |
| "Should we pause this drip?" | RPS of the touched cohort over 90 days |
UTM conventions for newsletters, sequences, and broadcasts
Email attribution is mostly UTM hygiene — a free UTM builder keeps the values consistent, and a UTM checker catches the case-and-typo mistakes before a broadcast goes out. The other 20% is the Stripe-side join. UTMs are how you tell your analytics what to call the click; the join is how you tell your analytics what the click was worth. Both have to be right.
The canonical UTM scheme I use across attrifast.com and every client property:
?utm_source=<esp-or-list-slug>
&utm_medium=email
&utm_campaign=<campaign-or-sequence-slug>
&utm_content=<link-position-or-cta-asset>
&utm_term=<segment-or-test-variant>  (optional)
The five-parameter version covers every reporting question I have ever needed to answer. Three-parameter (source/medium/campaign) is the minimum. Anything less is malpractice.
Per email type, the conventions:
| Email type | utm_source | utm_medium | utm_campaign | utm_content |
|---|---|---|---|---|
| Newsletter broadcast | newsletter | <yyyy-mm-dd>-<topic-slug> | hero / body-link-1 / footer-cta | |
| Promotional broadcast | promo | <campaign-slug> | hero / inline-1 / button-1 / footer | |
| Lifecycle / nurture sequence | <sequence-slug> | email-sequence | step-<n>-<topic> | cta-primary / cta-secondary |
| Onboarding sequence | onboarding | email-sequence | step-<n>-<topic> | cta-primary / cta-secondary |
| Cart abandonment | cart-abandon | email-flow | hour-<n>-reminder | cta-recover / cta-discount |
| Post-purchase | post-purchase | email-flow | step-<n>-<topic> | cta-related / cta-review |
| Re-engagement / winback | winback | email-flow | win-back-<segment> | cta-special-offer |
| Transactional with marketing tail | transactional | <event-name> | cta-upsell | |
| Cold outbound (1:1 sales) | cold-outbound | email-outbound | <sequence-or-rep-name> | cta-call / cta-reply |
| Drip from blog opt-in | blog-drip | email-sequence | <post-slug>-drip | cta-trial |
The utm_medium=email vs utm_medium=email-sequence vs utm_medium=email-flow distinction is intentional. It lets you cleanly separate broadcast revenue (one-to-many, time-bounded) from sequence revenue (triggered, always-on) in your dashboard without having to re-bucket campaigns by hand. Most ESPs let you set utm_medium per campaign or per flow.
A worked example for a Tuesday newsletter from a SaaS company:
https://attrifast.com/blog/email-marketing-attribution-guide?utm_source=newsletter&utm_medium=email&utm_campaign=2026-05-26-email-attribution&utm_content=hero-link
The same article cited in a 5-step onboarding sequence:
https://attrifast.com/blog/email-marketing-attribution-guide?utm_source=onboarding&utm_medium=email-sequence&utm_campaign=step-3-attribution-101&utm_content=cta-primary
The same article promoted in a Klaviyo cart-abandonment flow:
https://attrifast.com/blog/email-marketing-attribution-guide?utm_source=klaviyo&utm_medium=email-flow&utm_campaign=cart-abandon-hour-24&utm_content=cta-recover
Three different UTM signatures, one URL, three distinct revenue lines in your analytics. This is the whole game.
A few subtle rules that catch operators out:
| Rule | Why |
|---|---|
| utm_source is always lowercase | GA4 and most analytics tools are case-sensitive; Newsletter and newsletter count as different sources |
| Never use spaces; use hyphens | Spaces get URL-encoded to %20 and break grouping in some tools |
| Keep utm_campaign under 50 characters | Some analytics dashboards truncate longer strings |
| Use date prefix on broadcasts (yyyy-mm-dd) | Lets you sort chronologically without joining to a send-date table |
| Use step number prefix on sequences (step-01, step-02) | Lets you reconstruct sequence flow from UTM alone |
| Match utm_content to the visual asset | "hero" vs "footer-cta" lets you A/B different placements |
| Do not repeat the source in the campaign | utm_source=newsletter&utm_campaign=newsletter-may-26 is redundant noise |
The single biggest hygiene win is a UTM builder template you embed in every email-sending workflow. The simplest possible version is a Google Sheet with five columns (the five UTMs), an autogenerated URL column with =ENCODEURL wrapping, and a copy-button column. The more sophisticated version is a small in-house tool that enforces the schema. The intermediate version is to install a UTM-builder Chrome extension and document the conventions in your team's marketing playbook. The version that fails is "each marketer picks their own UTMs" which guarantees three months later your analytics is a graveyard of utm_source=Email, utm_source=email, utm_source=EMAIL, utm_source=NL, and utm_source=newsletter_v2_FINAL.
ESP attribution capabilities compared
Every major ESP exposes some flavor of revenue attribution, with sharply different capabilities, defaults, and blind spots. The matrix that matters:
| ESP | Tracks revenue natively | Stripe integration | Default attribution window | Per-link click attribution | Sequence (flow) revenue attribution | Segment-level revenue | Notable blind spots |
|---|---|---|---|---|---|---|---|
| Mailchimp | Yes (ecommerce module) | Shopify, WooCommerce; Stripe via Zapier | 24h click / 7d open (legacy) | Yes | Limited (Customer Journey Builder) | Yes | Subscription renewals; refunds |
| Klaviyo | Yes (deep ecommerce) | Shopify, BigCommerce, Magento; Stripe via API | 5d click / 1d view | Yes | Yes (Flows) | Yes (excellent) | SaaS use cases; subscription churn; refunds outside Shopify |
| Beehiiv | Limited (Boosts / 3D Analytics) | Stripe (for paid subscriptions only) | 30d click for boosts | Yes | No (Beehiiv is broadcast-first) | Limited | Ecommerce revenue; non-Stripe revenue; product-side conversions |
| ConvertKit / Kit | Limited (Commerce module) | Stripe (for Kit Commerce purchases only) | 30d click | Yes | Yes (Sequences and Visual Automations) | Yes | External Stripe revenue; Shopify revenue |
| Substack | Limited (subscription attribution) | Stripe (proprietary integration) | n/a (subscription model) | Yes | n/a | Limited (publisher dashboard) | External product revenue; sponsorship revenue; UTM tracking on internal links |
| ActiveCampaign | Yes | Stripe via Deep Data | 30d click | Yes | Yes (Automations) | Yes | Non-AC-sourced touches; multi-touch context |
| HubSpot | Yes (Marketing Hub) | Native | First-touch / last-touch toggleable | Yes | Yes (Workflows) | Yes | Free tier limits; pricing escalates fast |
| Customer.io | Yes | Via webhook | Configurable | Yes | Yes (Campaigns) | Yes | Requires engineering setup; no native ecommerce UI |
| Loops | Limited (early stage) | Stripe (via webhook) | Configurable | Yes | Yes | Limited | New product; revenue attribution layer still evolving |
| Postmark / SES | No (transactional only) | n/a | n/a | No (not their job) | n/a | n/a | Not designed for marketing attribution |
The clear functional split: Klaviyo and HubSpot are the most complete revenue-attribution ESPs for ecommerce and B2B respectively, both struggle outside their core verticals, and neither produces a number that matches Stripe's net revenue line without manual reconciliation. Beehiiv and Substack are excellent at their core jobs (creator newsletters, paid subscriptions) and not really competing on cross-channel revenue attribution. Mailchimp's revenue module is functional and dated, with the attribution defaults the most quietly wrong of the group.
The defaults that bite people:
| ESP | Default that surprises | Why it matters |
|---|---|---|
| Klaviyo | 5-day click window, attributes 100% of purchase to last clicked email | A purchase 6 days after the click is invisible; a purchase touched by 3 emails attributes 100% to email #3 |
| Mailchimp | 24-hour click window | Brutal for B2B sales cycles; misses most week-long consideration windows |
| Beehiiv | Conversion pixel required on every conversion page | Sites that do not install the pixel see zero conversion data |
| ConvertKit | Stripe integration only sees Kit Commerce products | External Stripe products invisible to ConvertKit's attribution |
| Substack | Internal-only attribution; no UTM passing on share links | "Where did this subscriber come from?" is hard to answer outside Substack itself |
| HubSpot | First-touch is the default model (changed from last-touch in 2023) | Email-as-nurture-channel underreported under first-touch |
| ActiveCampaign | Deep Data integration requires manual setup per platform | Easy to enable for Shopify, hard for custom Stripe |
The implication for any operator running on these tools: read the docs for your specific ESP's attribution defaults, write down the window and the model, and assume the dashboard number is off by 10-40% from your Stripe ledger until you have done the reconciliation. The exact size of the gap is unknowable a priori. The existence of the gap is universal.
Connecting ESP to Stripe revenue without enterprise tools
The classic enterprise pattern for ESP-to-Stripe attribution is Segment in the middle: ESP fires a click event into Segment, Stripe fires a payment event into Segment, an identity resolution layer joins them, and a customer data warehouse (Snowflake, BigQuery) does the SQL math. The pattern works. It costs $40k-$150k/year all-in for a sub-$5M ARR business and requires at least one full-time data engineer. For a bootstrapped SaaS or DTC store, this is not the right architecture.
The cookieless, no-data-warehouse pattern that actually works at SMB scale:
The three pieces:
Piece 1: UTM-tagged links in every email. Already covered. Without these, attribution is a guessing game.
Piece 2: First-party session identifier. A small JavaScript snippet on every page of your site reads URL parameters on page load, persists the UTM values into a first-party localStorage or sessionStorage token, and sends a session row to your own backend (not a third-party analytics provider). The backend stores a row keyed by a generated session ID with the UTM fields, the user-agent, the timestamp, and the landing URL. This row is scoped to your own domain and is not subject to third-party cookie rules, ITP, or most consent-banner regimes.
The minimal pseudocode:
function captureEmailSource() {
  const params = new URLSearchParams(window.location.search);
  const utmFields = {
    utm_source: params.get('utm_source'),
    utm_medium: params.get('utm_medium'),
    utm_campaign: params.get('utm_campaign'),
    utm_content: params.get('utm_content'),
    utm_term: params.get('utm_term'),
  };

  if (utmFields.utm_medium && utmFields.utm_medium.startsWith('email')) {
    const sessionId = getOrCreateSessionId();
    fetch('/api/track/session', {
      method: 'POST',
      body: JSON.stringify({ sessionId, ...utmFields }),
    });
  }
}
captureEmailSource();
Real implementations add bot filtering, idempotency, batching, and consent checks, but the core is 20 lines of code. The session ID is a UUID stored in localStorage and propagated to your Stripe Checkout via Checkout metadata.
Piece 3: Stripe webhook handler with metadata join. When the user converts to a Stripe Checkout, pass the session ID into Checkout's metadata field:
const session = await stripe.checkout.sessions.create({
  // ... other fields
  metadata: {
    attribution_session_id: getSessionId(),
  },
});
Then in your Stripe webhook handler, on checkout.session.completed, read event.data.object.metadata.attribution_session_id, look up the corresponding session row in your database, and write a revenue row with the joined UTM attribution:
app.post('/webhooks/stripe', async (req, res) => {
  const event = stripe.webhooks.constructEvent(req.body, sig, secret);
  if (event.type === 'checkout.session.completed') {
    const session = event.data.object;
    const attributionSessionId = session.metadata?.attribution_session_id;
    if (attributionSessionId) {
      const attribution = await db.sessions.findById(attributionSessionId);
      await db.revenueAttributions.create({
        stripe_session_id: session.id,
        amount: session.amount_total,
        currency: session.currency,
        customer: session.customer,
        utm_source: attribution.utm_source,
        utm_medium: attribution.utm_medium,
        utm_campaign: attribution.utm_campaign,
        utm_content: attribution.utm_content,
        attributed_at: new Date(),
      });
    }
  }
  res.json({ received: true });
});
That is the entire pattern. UTM in, session captured, Stripe metadata join, revenue attributed. No third-party cookies, no consent banner under most jurisdictions, no Segment, no data warehouse, no $40k contract. It runs in a few hundred lines of code on any Node, Python, or Go backend.
For subscriptions, the same pattern handles renewals and churn. The Stripe invoice.payment_succeeded webhook fires every renewal cycle with the subscription ID; you look up the original attribution_session_id from the subscription's metadata and attribute the renewal revenue. The same handler can catch customer.subscription.deleted for churn attribution by initial channel. This is the level of detail Klaviyo, Mailchimp, and Beehiiv structurally cannot provide because they do not see Stripe's billing webhooks.
The architectural diagram for the full lifecycle:
This is the architecture Attrifast ships as a managed service, with the additional bits — bot filtering, fraud screening, identity stitching across devices, multi-touch model support — pre-built. The pattern is the same whether you adopt or build. The UTM-to-revenue tracking feature page walks the same architecture from the product side. For the Stripe-specific integration mechanics, the Stripe integration page covers the restricted-key and webhook setup end-to-end.
Newsletter benchmarks: RPC and RPS by vertical
The single most useful exercise after wiring the attribution stack is to benchmark your numbers against vertical medians. The numbers below are aggregated from the Attrifast customer base (Q1 2026, n=47 sites with healthy email programs) and cross-referenced against published industry data where available. The vertical breakdowns:
B2B SaaS by ARR tier
| ARR tier | Monthly RPS | Median RPC | Median CTR | Send cadence (sweet spot) |
|---|---|---|---|---|
| Sub-$100k ARR | $0.20-$0.80 | $2.40 | 3.2% | Weekly |
| $100k-$500k ARR | $0.40-$1.60 | $4.20 | 2.8% | Weekly to bi-weekly |
| $500k-$2M ARR | $0.80-$2.40 | $8.10 | 2.4% | Bi-weekly |
| $2M-$10M ARR | $1.20-$3.20 | $14.50 | 2.1% | Bi-weekly to monthly |
| $10M+ ARR | $1.40-$4.80 | $28.00 | 1.9% | Monthly + segmented drips |
The RPC trend (rising with ARR tier) is intuitive: higher-ARR products have higher average deal sizes, so each clicked email converts to a larger dollar amount. The CTR trend (falling with ARR tier) is also expected: larger lists are more diluted, and the marginal subscriber on a 100k-person list is less engaged than the marginal subscriber on a 1k-person list.
DTC ecommerce by AOV tier
| AOV tier | Monthly RPS | Median RPC | Median CTR | Send cadence (sweet spot) |
|---|---|---|---|---|
| Sub-$25 AOV | $0.40-$1.20 | $0.62 | 1.4% | 2-4x/week |
| $25-$75 AOV | $0.80-$2.20 | $1.48 | 1.6% | 2-3x/week |
| $75-$150 AOV | $1.20-$3.20 | $3.10 | 1.8% | 2x/week |
| $150-$300 AOV | $1.80-$5.40 | $6.40 | 2.0% | Weekly |
| $300+ AOV | $2.40-$8.40 | $14.80 | 2.2% | Bi-weekly |
DTC's send cadence sweet spot is meaningfully higher than B2B SaaS for the same reason Klaviyo's send-frequency study found [5]: ecommerce buyers are in a near-continuous purchase mode, while B2B buyers are in a punctuated evaluation mode.
Creator newsletters by monetization model
| Monetization | Monthly RPS | Notes |
|---|---|---|
| Paid subscription (Substack, Beehiiv, Ghost) | $4-$15 | RPS = (paid subs × MRR) / total list |
| Sponsorship-driven (free newsletter) | $0.20-$1.50 | Highly variable; depends on niche CPM |
| Affiliate-driven (free newsletter) | $0.10-$0.80 | Skewed by audience purchase intent |
| Course/product-driven (free newsletter funneling to own product) | $1.50-$8.00 | Best margin model; harder to scale |
| Hybrid (paid sub + sponsor + own product) | $3.00-$20.00 | The Lenny / Packy / Stratechery model |
Premium niche newsletters like Lenny's Newsletter (product management), Stratechery (tech analysis), Not Boring by Packy McCormick (tech essays), and First 1000 by Ali Abouelatta (growth case studies) all cluster in the $5-$15 RPS range when measured cleanly. Public creator economy reporting from Lenny Rachitsky has implied a $5-$8M ARR business at one point with a sub-1M subscriber list, which back-calculates to RPS in that range [9].
Send-frequency vs revenue
Klaviyo's 2024 send-frequency study across 60,000+ ecommerce stores is the cleanest cross-list data on cadence [5]. The summarized finding:
| Sends per week | Indexed revenue per subscriber | Unsubscribe rate (relative) |
|---|---|---|
| 1 | 100 (baseline) | 1.0x baseline |
| 2 | 142 | 1.1x |
| 3 | 168 | 1.2x |
| 4 | 181 | 1.4x |
| 5 | 184 | 1.7x |
| 6 | 178 | 2.2x |
| 7+ | 165 | 3.5x |
The diminishing-returns curve is clear: revenue per subscriber peaks at 4-5 sends per week and starts declining past 5, while unsubscribe rate accelerates non-linearly past 5. For most DTC operators, 3-4 weekly sends is the right operating point. For B2B SaaS, the equivalent operating point is closer to weekly or bi-weekly because the buyer journey is longer and the marginal nurture send has less revenue impact.
List-segment attribution
A segmentation strategy without attribution is creative work without measurement. The five highest-leverage segments to attribute revenue on:
| Segment | Why it matters | Typical revenue lift over baseline |
|---|---|---|
| Most engaged 20% (top quintile by click activity) | Pareto distribution; the top 20% drives 70-80% of revenue | n/a (this IS the baseline for the rest) |
| Recent purchasers (last 30 days) | Highest repeat-purchase propensity in DTC | 2.4-4.2x baseline RPS |
| Cart abandoners (last 7 days) | Highest immediate conversion intent | 4.8-9.1x baseline RPS for the email itself |
| Free trial users (SaaS) | Highest conversion intent for SaaS | 8-20x baseline RPS during trial window |
| Lapsed (no purchase in 90+ days) | Winback opportunity; low responder but high LTV unlock | 0.4-0.8x baseline RPS, but high lifetime value when reactivated |
| Geographic segment (region-targeted promo) | Localized offers outperform generic | 1.2-1.6x baseline RPS for the targeted send |
Klaviyo's State of Email data has consistently shown segmented campaigns outperform broadcast campaigns by 3-5x on revenue per recipient [5], which roughly matches the Attrifast cross-stack data. The mechanism is intuitive: segmentation is targeting, and targeting is the entire game.
Sequence and nurture attribution: first-email vs last-email vs linear
When a customer subscribes to a 5-email onboarding sequence, opens emails 1, 2, and 4, clicks the CTA in email 4, and converts on email 4's landing page, which email gets credit for the revenue?
Three honest answers, each with a different operational implication.
First-touch attribution. The first email in the sequence (the welcome) gets full credit. This model favors awareness-stage emails and underweights closing-stage emails. Useful if you want to evaluate the welcome flow's overall effectiveness, but useless for optimizing later steps.
Last-touch attribution. The clicked email (#4) gets full credit. This is the default in Klaviyo, Mailchimp, and most ESPs. It overweights the proximate cause and underweights the nurture work that warmed up the lead. Most operators use this without realizing it.
Linear attribution. Each opened/touched email gets equal credit (in our example, emails 1, 2, and 4 each get 33%). This more honestly distributes credit across the sequence but breaks the moment any one email gets a bigger lift — you can no longer say "email #4 doubled revenue."
Time-decay attribution. Earlier emails get less credit, later emails get more, with credit decaying by half on each step backward. Compromise model. Useful for B2B sequences where the closing email matters most.
Position-based attribution (U-shaped). First and last touches get 40% each; middle touches split 20%. Used in classic Google Analytics multi-channel funnels. Useful when you want to credit both discovery and closing.
The decision matrix:
| Sequence type | Recommended attribution model |
|---|---|
| Welcome/onboarding (new signup → trial) | Linear or position-based (first email matters; last email closes) |
| Nurture / drip (long-term engagement) | Linear or time-decay |
| Cart abandonment (high-intent rescue) | Last-touch (the rescuing email is the cause) |
| Post-purchase upsell (cross-sell) | Last-touch (the upsell email is the cause) |
| Re-engagement / winback | Last-touch (the rescue email is the cause) |
| Newsletter broadcast (one-off) | Last-touch (no sequence to distribute over) |
| Multi-channel including email + paid + SEO | Linear or data-driven (out of scope of this article) |
The 80/20 recommendation for SMB SaaS and DTC in 2026: use last-non-direct attribution as the default for everything, with a 7-day window for one-time purchases and a 30-day window for subscriptions. Linear-attribute only the sequences where you specifically want to evaluate the sequence-as-a-whole, and only after you have last-touch numbers as the baseline. Multi-touch attribution sounds sophisticated and rarely pays for its operational overhead at sub-$5M ARR. That collapses the real decision down to two models, and the tradeoff between first-touch vs last-touch attribution breaks differently below 500 conversions a month than the textbook answer suggests. The Animalz blog made this case persuasively for B2B content attribution in 2023 [12] and the same logic applies to email.
The companion table for sequence step-by-step revenue attribution:
| Sequence step | Typical click contribution | Typical revenue contribution (last-touch) | Typical revenue contribution (linear) |
|---|---|---|---|
| Step 1 (welcome) | 18% of total clicks | 12% of revenue | 24% of revenue |
| Step 2 (value-prop nurture) | 14% | 8% | 21% |
| Step 3 (social proof / case study) | 16% | 14% | 20% |
| Step 4 (offer / CTA-heavy) | 28% | 41% | 22% |
| Step 5 (urgency / final ask) | 24% | 25% | 13% |
Reading across the rows: last-touch crowns step 4 as the hero (41% of revenue), while linear distributes the credit more evenly (step 4 down to 22%). Both stories are true. The right model depends on what decision you are about to make. If you are thinking "should we cut step 1?" linear says no (24% credit), last-touch says maybe (12% credit). If you are thinking "should we double down on step 4?" both models agree, just by different magnitudes.
Setting up email attribution in Attrifast (10-min walkthrough)
The product walkthrough, because the article cannot pretend the author has no interest. The same architecture is buildable by hand; this is the managed version.
Step 1 (1 minute): Add the 4 KB Attrifast tracking script to every page of your site. One snippet in your <head>. No consent banner required under most jurisdictions because the script is first-party only.
Step 2 (3 minutes): Connect Stripe by pasting a restricted API key from your Stripe dashboard. Attrifast then registers a webhook on your Stripe account automatically, scoped to checkout.session.completed, invoice.payment_succeeded, customer.subscription.created, customer.subscription.deleted, and a few related events. No data leaves Stripe except the metadata and the customer ID.
Step 3 (2 minutes): Update your Stripe Checkout creation to pass the attribution_session_id in metadata. The script exposes a window.attrifast.getSessionId() helper. If you use Stripe Checkout Sessions directly, two lines of code. If you use Stripe Billing Portal or third-party checkout (Paddle, Lemonsqueezy), the equivalent path is documented per integration.
Step 4 (1 minute): Connect your ESP. Attrifast has direct integrations for Klaviyo, Mailchimp, Beehiiv, ConvertKit/Kit, ActiveCampaign, HubSpot, Customer.io, and Loops, which pre-tag every link with a consistent UTM scheme so you do not have to maintain UTM hygiene by hand. For ESPs without a direct integration (Substack, custom self-built ESPs), the manual UTM scheme described above works identically.
Step 5 (3 minutes): Send a test email with a known UTM signature, click the link, complete a Stripe test checkout. Verify the revenue line appears in the Attrifast dashboard under the correct email source and campaign within 60 seconds. If it does not, the diagnostic page surfaces which piece of the chain (script load, session capture, metadata pass-through, webhook firing, attribution lookup) failed.
After setup, the daily and monthly views surface:
| View | What it shows |
|---|---|
| Channel mix | Email's share of total revenue against organic, paid, AI, direct |
| Per-ESP revenue | Klaviyo vs Mailchimp vs Beehiiv revenue side by side |
| Per-campaign revenue | Each broadcast's revenue, sortable by RPC and total dollars |
| Per-sequence revenue | Each flow's revenue, by sequence step and attribution model |
| RPS by segment | Revenue per subscriber for each list and segment |
| Send-frequency chart | Revenue per send vs unsubscribe rate over time |
| Subscription LTV by source | First-touch and last-touch LTV per email campaign |
| Refund and churn impact | Revenue net of refunds, downgrades, and cancellations |
The full feature surface is at the revenue attribution page. The Stripe-specific architecture is at the Stripe integration page. The general UTM-to-revenue plumbing is at the UTM tracking page.
Common email attribution mistakes
Ten patterns I have seen often enough to call them mistakes, with the fix for each. Most I made personally before figuring out the fix.
Mistake 1: Reporting open rate as engagement. Already covered above. The open rate is a deliverability proxy contaminated by MPP pre-fetches. Use CTR for engagement.
Mistake 2: Trusting the ESP's revenue number against Stripe. Klaviyo, Mailchimp, Beehiiv, and ConvertKit all report revenue numbers that drift 10-40% off Stripe's net revenue monthly. The drift is structural (attribution window, refund blindness, subscription handling) not a bug. Use the ESP's number for relative comparison between campaigns; use Stripe (or a Stripe-native attribution tool) for absolute dollars.
Mistake 3: Using the wrong attribution window. Klaviyo's 5-day default is fine for DTC apparel and brutal for B2B SaaS with 14-day evaluation cycles. Mailchimp's 24-hour default is wrong for almost everyone outside flash sales. Set the window to match your sales cycle, not the ESP's default.
Mistake 4: Letting marketers pick their own UTMs. utm_source=email, utm_source=Email, utm_source=EMAIL, utm_source=newsletter, utm_source=NL will appear in your dashboard as five different sources. Enforce a schema; document it; build a UTM builder; train the team.
Mistake 5: Tagging only some links in the email. The "main CTA" gets a UTM; the footer-unsubscribe link does not; the inline-text link to a related post does not. Result: when someone clicks the inline link and converts, the conversion looks like Direct. Tag every outbound link.
Mistake 6: Counting Apple MPP "opens" as a leading indicator. The pre-fetches arrive within minutes of send, so the open-rate chart looks like a step function in the first hour. Real human opens trickle in over hours and days. Operators look at the early curve and think "wow, opens are great" when they are looking at Apple's caching schedule.
Mistake 7: Sending more because open rate looks high. If the open rate is MPP-inflated, the implied engagement is fake. Sending more to a list that looks engaged but is not engaged is the fastest path to deliverability problems, spam-folder placement, and list churn.
Mistake 8: Not splitting B2B from B2C engagement signals. B2B inboxes (Outlook, Gmail Workspace) are far less MPP-affected than consumer inboxes (iCloud, Apple-Mail-on-Gmail). A B2B list's open rate is closer to honest; a consumer list's is mostly fiction. Segment the metric, not just the campaign.
Mistake 9: Treating sequences and broadcasts as the same revenue line. Onboarding sequences earn revenue continuously as new subscribers flow through; broadcast campaigns earn revenue in a 24-72 hour spike. Lumping them together hides which is actually profitable and which is treadmill work.
Mistake 10: Reporting email revenue without netting refunds and churn. Klaviyo says you made $50k from email last month. Stripe says $7k of that refunded, $4k churned in the same window, and $3k was a chargeback. Net email revenue is $36k. Report the net, not the gross. The CFO will eventually find out anyway.
A bonus mistake from the EmailGeeks community that catches sophisticated teams [11]:
Mistake 11: Mixing transactional and marketing revenue in the same attribution bucket. Stripe's invoice.paid for a renewal is not the same as a checkout from a marketing email; treating them the same overstates marketing-attributable revenue by the entire baseline renewal revenue. Segment attribution by acquisition vs retention.
When sub-$50/mo ESP analytics are enough
The architecture in this article is right for an operator who needs Stripe-accurate, multi-source revenue attribution and who is willing to wire up (or pay for) the cookieless first-party stack. It is over-engineered for several legitimate situations.
When sub-$50/mo ESP analytics are sufficient:
| Situation | Why ESP analytics is enough |
|---|---|
| Single-channel, single-product business | If 95% of revenue comes from one ESP-sourced channel, the ESP's own dashboard is approximately right |
| Pre-product-market-fit testing | At fewer than 100 customers, the noise floor swamps attribution precision |
| Hobby or side project | Engineering effort exceeds revenue improvement |
| No Stripe (cash, ACH, invoicing only) | The Stripe webhook pattern does not apply |
| Pure content business with ad/sponsor revenue (no direct conversion) | The conversion event lives outside your site |
| Single-creator newsletter on Substack/Beehiiv with no external products | Platform-native analytics aligns with monetization mechanic |
| Sub-1000 subscribers across all lists | Volume too low for cross-source attribution math to matter |
When the architecture in this article starts paying for itself:
| Situation | Why it justifies the work |
|---|---|
| Multi-channel acquisition (email + paid + organic + AI) | Need cross-channel reconciliation to compare apples to apples |
| Subscription or recurring revenue product | Renewal attribution is the value, not just first purchase |
| Multiple ESPs or platforms (Klaviyo + Beehiiv, Mailchimp + ConvertKit) | Need a unified revenue view across tools |
| Stripe is the source of truth for revenue | ESPs structurally cannot match Stripe's accuracy |
| Sales cycle longer than the ESP's default window | Need configurable, accurate attribution windows |
| Email is 15%+ of revenue and the number matters in board meetings | The precision delta affects strategic decisions |
| Investor or buyer due diligence | Channel revenue attribution is a routine question |
| Refund and churn netting matters | ESPs do not see Stripe refunds or churn |
| Team has shipped Stripe integration before | Marginal engineering cost is low |
| You suspect ESP numbers are wrong but cannot prove it | The reconciliation is the project |
The honest decision framework: if you are pre-$10k MRR, ship ESP-native analytics, focus on growing the list, and revisit. If you are between $10k and $100k MRR, the Stripe-side join starts paying for itself in cleaner channel decisions. Past $100k MRR, the attribution layer is essentially required to run the business with any precision. Sub-$50/mo, the closest-to-good-enough tools are Plausible (clicks only, no revenue) or Fathom (same) paired with manual Stripe reconciliation in a spreadsheet. If you want the wider field at that price point, we benchmarked 12 conversion tracking software tools on accuracy, privacy, and setup time, and only two of them track revenue without cookies. Past that, the dedicated attribution layer wins on time alone.
What changes about your email workflow when this is in place
The shape of the email team's weekly review changes once Stripe-joined attribution is wired up. The before/after, abbreviated:
| Review item | Before correct attribution | After correct attribution |
|---|---|---|
| Subject-line test winner | Open-rate-based (broken under MPP) | RPC-based (real revenue per click) |
| Send-time optimization | Open-time-weighted (MPP-distorted) | Click-time-weighted (clean signal) |
| Sequence step optimization | Click-based with no revenue context | Click-based plus RPC and step-level revenue contribution |
| Segment investment decision | "Which segment opens most?" | "Which segment has highest RPS?" |
| Cadence decision | "Are we sending too much?" (vague) | "Is marginal send still positive RPC?" (specific) |
| List health audit | Open-rate-based engagement scoring | Click-and-conversion-based engagement scoring |
| Re-engagement campaign trigger | "Has not opened in 60 days" | "Has not clicked in 90 days" |
| Welcome flow ROI | Open-rate funnel from step 1 to step 5 | RPS attributable to sequence over 30-day window |
| Promotional campaign post-mortem | Open rate, click rate, revenue (loose attribution) | Revenue, RPC, segment-level breakdown |
| Annual board reporting | "Email drives X% of clicks" | "Email drives X% of net revenue, with $Y RPS and $Z RPC" |
| Budget allocation across ESPs | Gut-feel | RPS-per-ESP-per-segment comparison |
| Lifecycle vs broadcast investment | "Both seem to work" | Sequence revenue vs broadcast revenue, both net of refunds |
The pattern across all rows: every decision moves from a proxy metric (opens, generic clicks) to a revenue metric. The strategic implication is that the email team's bonuses, OKRs, and quarterly reviews should also move from opens to revenue. The political implication is that this is hard because someone built the dashboards.
A short note on transactional vs marketing email attribution
One subtlety worth calling out because it is a frequent source of double-counting. Transactional emails (order confirmations, password resets, shipping notifications, receipts) are technically email sends and often contain clickable links, but they are not marketing emails and should not be in the marketing attribution rollup.
The boundary cases:
| Marketing attribution? | Why | |
|---|---|---|
| Order confirmation | No | Triggered by purchase; attributing further revenue to it double-counts |
| Shipping notification | Generally no | Triggered by shipping; usually no marketing CTA |
| Password reset | No | Pure account function |
| "Your trial ends in 3 days" | Yes (lifecycle) | Marketing intent; drives renewal revenue |
| Welcome email after signup | Yes | First marketing touchpoint of the lifecycle |
| Receipt with cross-sell | Partially | Receipt is transactional; cross-sell module is marketing — attribute only the cross-sell click |
| "Your subscription renewed" | No | Renewal is the conversion, not the cause |
| Re-engagement after lapse | Yes | Marketing intent; drives reactivation revenue |
| Product update / changelog | Yes (lifecycle / engagement) | Marketing intent; drives feature adoption and retention |
The practical implementation: tag transactional emails with utm_medium=transactional (not email) so they are easy to filter out of the marketing rollup. The corresponding revenue attribution should treat them as a separate channel — useful for product analytics, not for marketing-spend ROI.
Limitations
Six things this article and the framework above do not cover, and you should not extrapolate past.
- Cross-device email attribution. A user who opens an email on their phone, clicks the link on their laptop later, and converts a day later on their tablet will look like three different sessions unless your stack has identity stitching. No reliable cookieless fix; treat as a known undercount.
- Pre-purchase email influence on offline conversions. B2B sales cycles often have email touches followed by a phone call or in-person meeting that closes the deal. The Stripe webhook fires on payment, but the credit attribution path is murky if the closer did not capture the email source.
- Forwarded emails and shared links. A subscriber forwards your email to a colleague; the colleague clicks and converts. UTMs preserve, attribution credits the original subscriber's source, but the second user is technically not on your list. Edge case but real for B2B.
- Multi-list multi-ESP deduplication. A subscriber on your Klaviyo list and your Mailchimp list and your Beehiiv list, who receives the same offer from all three and converts on the Beehiiv one — should the other two get any credit? Multi-touch question; out of scope.
- The 1.4-2.1x RPS multiplier on highly engaged segments is a snapshot. As your list grows the engaged subset stays the same size, so the multiplier compresses over time. Re-measure quarterly.
- Apple's MPP behavior may change. Apple has not announced changes to MPP since the 2021 launch. If they ever roll back the pre-fetch behavior, open-rate becomes a real metric again. Plan for either world; current 2026 architecture assumes MPP stays.
FAQ
Why is the open rate not a real metric anymore?
Because Apple Mail Privacy Protection, shipped in iOS 15 in September 2021, pre-fetches every tracking pixel for users who opt in (most do). When the pixel fires from an Apple proxy and not a human, the recipient looks like they opened the email even if they did not. Litmus measured Apple Mail at 53.5% of US email opens by mid-2022, which means more than half of all open events are now machine-generated, not human-generated. The number ESPs surface as "open rate" is a weighted average of real human opens, MPP pre-fetches, and other anti-spam pre-scanning. Treating it as engagement is a category error. The honest replacement metric is click-through rate plus, ideally, revenue per click.
What is the best free way to attribute revenue to email campaigns?
Tag every link in every email with a consistent UTM scheme: utm_source=<esp>, utm_medium=email, utm_campaign=<campaign-slug>, utm_content=<link-position-or-asset>. Then in your analytics layer, group by utm_medium=email and segment by utm_campaign. The pattern works in GA4, Plausible, Fathom, Simple Analytics, and any first-party analytics tool. The catch is the join from session to revenue. GA4 will give you session-level data; for actual revenue you need either GA4 ecommerce events fired on the Stripe success page (lossy, breaks on subscription renewals), or a server-side join via Stripe webhook (the path Attrifast takes). The free version gets you click attribution. The paid version closes the loop to dollars.
Why does Klaviyo show different revenue numbers than my Stripe dashboard?
Three reasons. First, Klaviyo's default attribution window is 5 days for email and 1 day for SMS, so any purchase outside the window is dropped. Second, Klaviyo attributes the full purchase amount to the last touched email even if the customer also clicked a Google ad and a Facebook ad in the same window, which over-credits email. Third, Klaviyo does not see refunds, chargebacks, failed renewals, or downgrade events fired through the Stripe billing API, so the number drifts away from Stripe's net revenue line every month. The fix is to treat Klaviyo's revenue line as a directional engagement metric and use Stripe (or a Stripe-native attribution tool) as the source of truth for actual dollars.
What is revenue per subscriber and what is a good number?
Revenue per subscriber (RPS) is total revenue attributable to a list divided by the number of active subscribers in a defined window, usually monthly or quarterly. Across the SaaS and DTC sites I have measured in Attrifast through Q1 2026, monthly RPS lands between $0.40 and $3.20 for B2B SaaS lists, $0.60 to $2.80 for DTC ecommerce lists, and $1.50 to $8.00 for high-LTV niche newsletters that sell their own products. Klaviyo's published 2024 benchmarks for ecommerce list RPS in apparel sat near $1.59 per monthly active subscriber. Beehiiv and Substack do not publish RPS directly, but creator-reported numbers from publishers like Lenny Rachitsky and Packy McCormick imply $4-$15 monthly RPS on highly engaged paid-newsletter lists. The number to beat is what you spent acquiring the subscriber divided by the months until payback.
Does send frequency hurt revenue?
Not the way most operators assume. Klaviyo's 2024 send-frequency study across 60,000 ecommerce stores found that lists sending 2-4 campaigns per week produced the highest revenue per subscriber, with diminishing returns past 5 weekly sends and a real unsubscribe spike past 7. HubSpot's 2024 State of Marketing data and Litmus benchmarks tell a similar story for B2B: weekly cadence outperforms monthly on revenue per subscriber for nearly every B2B vertical except enterprise sales where bi-weekly wins. The wrong question is "how often is too often." The right question is "what is the revenue per send, and is the marginal send still positive." If revenue per send stays above your unsubscribe-replacement cost, send more. If it drops below, send less.
Should I use first-touch, last-touch, or linear attribution for email sequences?
For nurture sequences (drip, onboarding, lifecycle), last-non-direct attribution is the honest default because most sequences are post-acquisition reinforcement, not first-touch acquisition. For broadcast campaigns (newsletters, product launches, promotions), last-non-direct also wins because broadcast emails are the proximate cause of the click. Linear attribution is appealing in theory and rarely matters in practice for sub-$5M ARR businesses; the operational overhead of multi-touch models exceeds the decision-improvement value. First-touch attribution should be reserved for the rare case where you can prove the email was genuinely the first-ever marketing exposure, which is hard to validate without cross-channel identity stitching. The 80% answer for most SMB SaaS and DTC is: last-non-direct attribution with a 7-day click-to-conversion window for one-time purchases, 30-day for subscriptions.
Can I track email revenue without a tracking pixel?
Yes, and you should, because Apple MPP made the tracking pixel meaningless for open measurement anyway. The cookieless email attribution stack is three pieces: UTM tags on every link in every email (defines the source), a first-party session identifier scoped to your own domain (carries the email source across the visit), and a Stripe webhook handler that joins the session to the eventual payment via Checkout metadata. None of those three pieces require a tracking pixel, a third-party cookie, or a consent banner under most jurisdictions. This is the architecture Attrifast ships and the same pattern works for any first-party analytics stack you build yourself.
How does Beehiiv's revenue attribution compare to Klaviyo's?
Beehiiv launched a "Boosts" marketplace and a 3D Analytics view in 2024 that surfaces clicks, conversions, and ad spend per campaign, but the conversion tracking is opt-in pixel-based and lives inside Beehiiv's universe. Klaviyo has been doing ecommerce conversion attribution since 2014 via deep Shopify, BigCommerce, and Magento integrations and tracks per-campaign revenue down to the SKU level. For pure newsletter operators monetizing through ads, sponsorships, and paid subscriptions, Beehiiv's analytics are sufficient. For ecommerce operators selling physical or digital products through Stripe or Shopify, Klaviyo is the more complete ESP and Beehiiv is not really competing in the same category. Neither tool produces Stripe-net-revenue-accurate numbers without an external join.
What is the lowest-effort change I can ship this week to improve email attribution?
Pick one ESP, audit your last 30 days of campaigns for UTM consistency, and standardize on a four-parameter scheme (source/medium/campaign/content). Document the scheme in a one-page playbook your marketing team can reference. Update the default link-builder in your ESP (most have one) to auto-populate the scheme. The audit takes an hour; the standardization takes an afternoon; the deliverable is that next month's revenue attribution will be substantially more reconcilable than this month's. If you only do one thing from this article, do that.
Is email attribution different for B2B SaaS than for DTC ecommerce?
Yes, in three ways. First, the sales cycle is longer, so the attribution window needs to be longer (30 days minimum for B2B vs 5-7 days for DTC). Second, the conversion is often a multi-step funnel (email → demo signup → demo → contract) rather than a single checkout, so the attribution needs to chain through multiple events not just one. Third, the revenue per converted customer is much higher and lumpier, so a single missed attribution distorts the channel ROI more than it would in DTC. The Stripe-webhook-join architecture handles all three with windowing and subscription handling.
What about SMS attribution? Same playbook?
Mostly yes. UTM tagging works identically (utm_medium=sms). The window is shorter (SMS click-to-conversion is usually within 24-48 hours). The opt-in regime is stricter (TCPA in the US, GDPR consent in EU). Otherwise the same Stripe-webhook-join architecture works for SMS revenue attribution as for email. Klaviyo's SMS module surfaces revenue using a 1-day default window, which is the right shape for the channel.
Can I retroactively fix bad UTM hygiene from the last year?
Partially. Going forward, standardize. For historical data, you can map known historical UTM variants to canonical sources in a lookup table during analysis (so utm_source=Email and utm_source=NL both bucket as newsletter). This recovers analytical insight without rewriting the raw data. You cannot retroactively recover attribution for emails that had no UTM at all; those visits will remain in Direct/(none).
What is the right team ownership of email attribution?
Joint: marketing owns the campaigns and the UTM hygiene, engineering owns the tracking script and the webhook handler, finance owns the reconciliation against Stripe. The single most common organizational failure is "marketing assumes engineering owns it" while "engineering assumes marketing owns it." Pick a single owner for the cross-functional reconciliation — usually a head of growth, head of marketing, or revenue operations manager — and make them accountable for the monthly Stripe-vs-ESP variance number.
How long until I see a clean attribution signal after wiring this up?
Click attribution: immediate. Conversion attribution: one full sales cycle (so 7-30 days depending on your product). List-level RPS comparisons: 60-90 days, because RPS needs enough cohort depth to average out campaign noise. Segment-level comparisons: 90 days or one full segment cohort, whichever is longer. The whole picture stabilizes around quarter one; trust the trends, not the single-week numbers, until then.
References
- Litmus — Email Client Market Share, mid-2022 update. 2022
- Litmus — The 2024 State of Email Engagement Report (Apple Mail share update). 2024
- Apple — About Mail Privacy Protection. Apple Support
- Mailchimp — Email Marketing Benchmarks and Statistics by Industry. 2024
- Klaviyo — 2024 Email and SMS Marketing Benchmarks
- Beehiiv — Newsletter benchmarks and the State of Email 2024
- Substack — Publisher reports and Office Hours guidance
- HubSpot — The State of Marketing 2024 (email ROI section)
- Lenny Rachitsky — Lennys Newsletter — public revenue and subscriber reporting
- ConvertKit / Kit — 2024 Creator Benchmarks Report
- EmailGeeks Slack community — MPP impact threads and ESP open-rate inflation…
- Animalz — Content attribution in B2B SaaS: when multi-touch is not worth it
- Stripe — Checkout Session metadata field
- Stripe — Webhook event types reference
- Tomasz Tunguz — SaaS email benchmarks and conversion ratios
- OpenView Partners — SaaS benchmarks (including email and channel mix data)
- Packy McCormick — Not Boring publisher reports and creator-newsletter economics
- Google Analytics — Default channel group definitions for GA4
- The Verge — Apples Mail Privacy Protection coverage and rollout reporting, 2021-2022
- Email on Acid / Sinch — Email client usage and MPP impact tracking
For the practical implementation of UTM-to-revenue attribution on your own stack, the UTM-to-revenue tracking feature page walks the architecture from the product side. For Stripe-specific integration, the Stripe integration page covers the restricted-key and webhook setup end-to-end. For the broader revenue-attribution surface across all channels (not just email), the revenue attribution feature page is the entry point. For the adjacent AI-traffic attribution problem, the ChatGPT referral analytics guide covers the same Stripe-webhook-join pattern applied to AI engines, and the AEO vs SEO in 2026 piece covers where email fits in the broader 2026 attribution picture.