
Last spring I watched a founder walk his board through an AI visibility deck. The headline slide said the score had gone from 11 to 34 in a quarter. Everyone nodded. It was, by any reading of the chart, a good quarter.
Then someone asked what it had produced. Nobody in the room could answer, because the number had never been connected to anything downstream. Two weeks later we joined the same site's AI sessions to its Stripe charges. The 34 was real. It had been earned almost entirely on prompts like what is marketing attribution and how does UTM tracking work — questions asked by people writing blog posts, not people buying software. On the six prompts that named his category and a price point, he was still close to invisible.
That is the failure mode this whole article exists to prevent. AI visibility is a genuinely useful metric. It is also the easiest metric in modern marketing to move in a direction that does nothing for you, because the cheapest citations to win are the ones worth the least.
So before anyone buys a tool or sets a target: here is what the term actually means, what the number is computed from, what a good one looks like, and why it should never be read on its own.
What is AI visibility?
AI visibility is the measured rate at which an AI answer engine surfaces your brand or domain in its generated answers across a defined set of prompts, sampled repeatedly over time. It is expressed as a percentage or a 0-100 score, computed per engine and then optionally blended, and it answers exactly one question: when someone asks an AI engine about your category, how often does your name come up?
Four phrases in that definition are load-bearing, and every argument about AI visibility that goes badly is an argument about one of them.
"Measured rate." Not a position, not a placement, not a yes/no. A generative answer is probabilistic — ask the same question twice and you can get two different source lists. Google says this outright in its own guidance for site owners: AI Mode and AI Overviews may use different models and techniques, so the set of responses and links they show will vary [2]. A number derived from one run is an anecdote. Sampling each prompt several times is what turns it into a metric.
"Defined set of prompts." This is the part almost every vendor page glosses over and it is the single most important input. Your visibility score is a rate over a denominator you chose. Change the denominator and the score changes with it, with no change whatsoever in the outside world.
"Generated answers." AI visibility is presence inside the answer — a brand mention in the prose, a cited source in the reference list, or both. That is a different object from a ranking. Google's documentation is explicit that an AI Overview occupies a single position in search results, and that all links inside it are assigned that same position [3]. There is no first, second, third inside an AI answer in the way there is on a results page.
"Over time." A visibility score has almost no meaning as a snapshot and a great deal of meaning as a trend. Engines retrain, retrieval behaviour shifts, and competitors publish. The useful read is the direction and the slope.
For the academic framing of the same idea, the Princeton and Georgia Tech GEO paper is the origin point for treating this as a measurable quantity at all — it formalises generative engines as a category, proposes visibility metrics for content inside their responses, and demonstrates that content-side changes can move visibility by up to 40%, with efficacy varying by domain [1]. That last clause matters more than the headline number: there is no single lever, and there is no single benchmark.
How does AI visibility relate to prompt tracking, share of voice, and GEO?
These four terms get used as synonyms in vendor copy and they are not synonyms. They sit at different levels of the same stack, and confusing them is how teams end up buying the wrong thing.
| Term | What it is | Level | Relationship to AI visibility |
|---|---|---|---|
| AI visibility | The measured rate at which engines surface you across a defined prompt set | The concept | The umbrella. Everything below either produces it or is derived from it |
| Prompt tracking | Running a prompt set across engines on a schedule and logging every answer and cited source | The mechanism | Produces the raw data that visibility is computed from |
| Citation rate | Share of tracked prompts where your domain appears in an engine's cited sources | A derived metric | One specific way of expressing visibility, per engine |
| Share of voice | Your citations as a proportion of all citations across all brands on the same prompt set | A derived metric | Relative visibility. Moves independently of your absolute rate |
| GEO / AEO | The practice of changing content, structure and off-site presence to get surfaced more often | The intervention | The work you do to move visibility. Not a measurement |
| AI visibility score | A single 0-100 rollup of the above, per engine or blended | A presentation layer | A summary, only as good as the prompt set beneath it |
The practical test: if a tool sells you "AI visibility" it should tell you which row it occupies. Most of the category lives in rows two through five. The intervention layer is a different purchase entirely, and the scoring layer is a chart, not a capability.
What is AI visibility actually measured from?
Three inputs, in strict order of importance.
1. The prompt set. A list of the questions your buyers actually ask, written in the register they actually use. Not keywords — questions. "Best Stripe revenue attribution tool for a bootstrapped SaaS" is a prompt. "stripe attribution" is a keyword, and asking an engine that returns something closer to a definition than a recommendation. Most prompt sets I see in the wild run 30 to 200 prompts and are the only part of the setup that requires real judgment about your market.
2. Repeated sampling across engines. Every prompt gets run on every engine you care about, on a schedule, several times. ChatGPT, Perplexity, Claude, and Gemini behave differently enough that a blended score hides the signal — and the mix underneath you is moving, with Similarweb measuring ChatGPT's share of worldwide generative AI web traffic sliding from roughly 76% a year ago to around 53% today while Gemini climbed past a quarter and Claude became the fastest-growing platform in the category [8] (panel estimates like these versus your own first-party actuals is the whole Attrifast vs Similarweb distinction).
3. Citation and mention parsing. Each returned answer is parsed for your domain and your competitors' domains, both as linked sources and as bare brand mentions in the prose. The output is a log: prompt, engine, run timestamp, every source cited, position in the source list. Everything else — visibility rate, share of voice, per-engine variance — is arithmetic on top of that log.
If you want the mechanics of step two and three in detail, that discipline has its own name and its own article: prompt tracking, defined from an operator's point of view. This piece stays on the concept the mechanics produce.
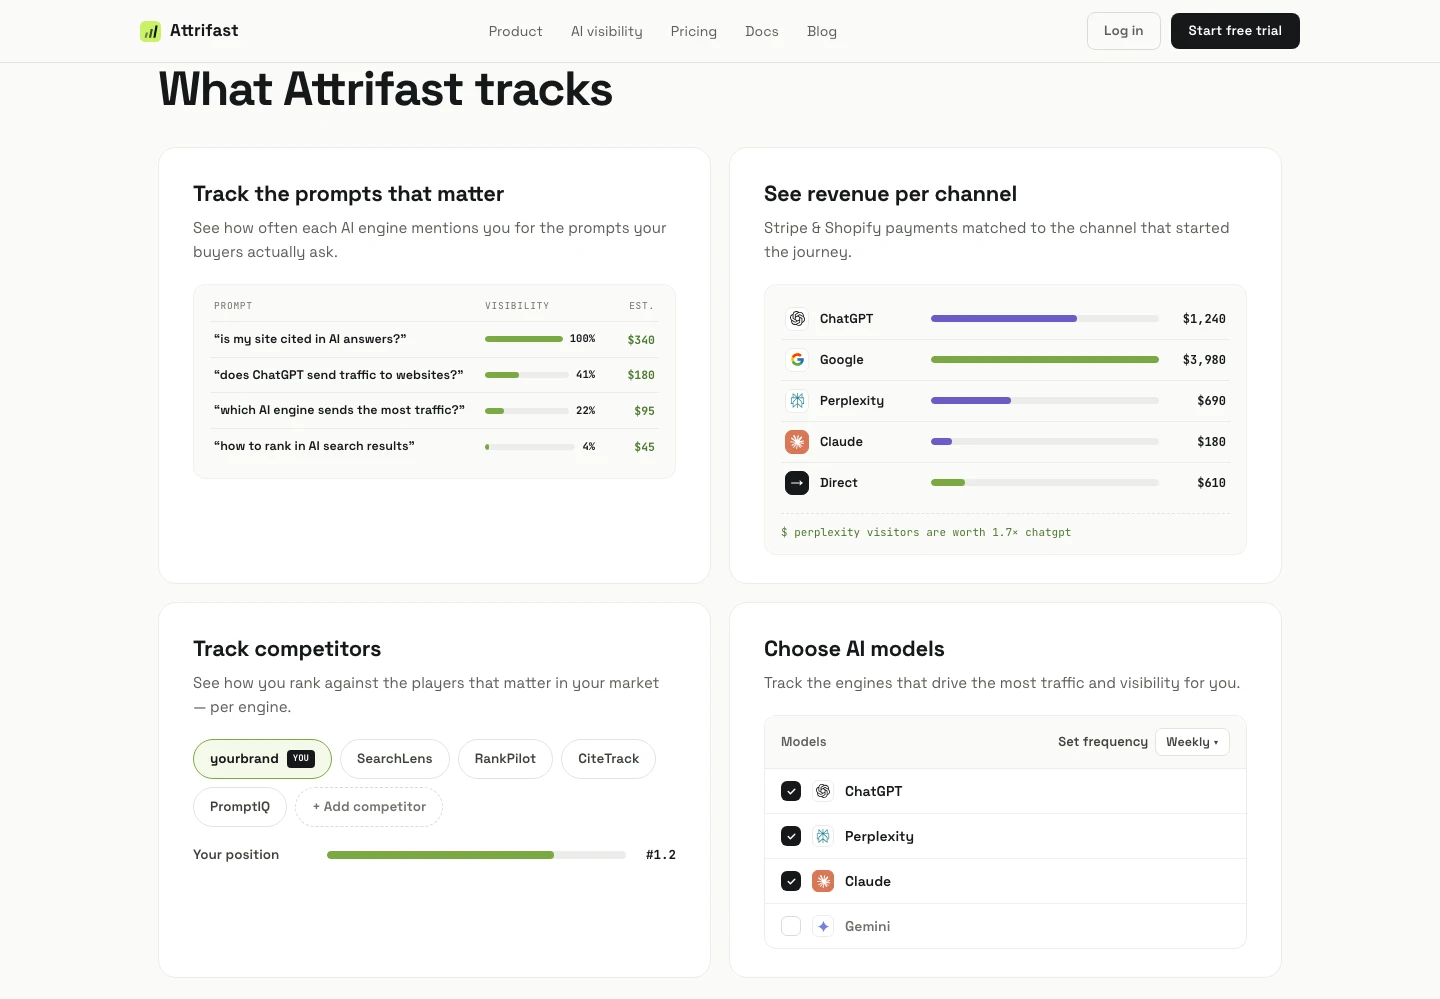
The reason our own product puts an estimated dollar value in the same row as the visibility percentage is the entire thesis of this article in one UI decision. In that screen, the prompt sitting at 100% visibility is worth less than half of what a prompt at 41% visibility is worth. A dashboard that showed only the left-hand column would tell you to keep defending the 100% and ignore the 41%. That is exactly backwards.
What counts as a good AI visibility score?
Here is the honest answer: the question is not answerable across brands, and anyone who answers it anyway has quietly assumed a prompt set on your behalf.
Consider the same company, on the same day, with the same content, scored three ways:
| Prompt set (30 prompts each) | What the prompts look like | Typical outcome | What the score licenses you to conclude |
|---|---|---|---|
| Branded | "What is Attrifast", "Attrifast pricing", "Is Attrifast any good" | Very high — engines resolve brand queries to the brand's own site | Almost nothing. You are being cited as the authority on yourself |
| Informational / definitional | "What is revenue attribution", "How do UTM parameters work" | Moderate to high if you publish reference content | That your content is retrievable. Not that anyone buying is reading it |
| Commercial / comparative | "Best Stripe attribution tool under $50 a month", "Alternatives to Triple Whale for a small SaaS" | Low for most brands, and hard-fought | Nearly everything. These are the prompts with buyers behind them |
This is a worked illustration of how prompt-set composition drives the number, not measured data.
A brand can post a 62 on the first row and a 9 on the third, and both are true statements about the same company. A vendor screenshot showing "your score: 38" without the prompt list underneath it is not a measurement you can act on — it is a number with a denominator hidden from you.
Which leads to the only two benchmarks I think are defensible:
- Internal trend. The same prompt set, the same engines, the same sampling cadence, week over week. Slope beats level.
- Relative position on identical prompts. Your citation count against named competitors, on the same prompts, in the same runs. Competitors entering your prompt set can drag your relative position down while your absolute rate holds flat — which is a real event worth knowing about, and invisible if you only track your own number.
Everything else — cross-industry averages, "the average brand scores X" claims, category leaderboards computed on prompt sets you have never seen — is directional entertainment. If you want the full metric taxonomy that sits on top of a raw visibility rate, including where citation rate, prompt coverage and per-engine variance fit, the ten AI visibility KPIs worth tracking covers it properly. And the 0-100 scoring methodology we use, including how the number is reported next to the revenue it produced, is written up in full.
How is AI visibility different from AI traffic and AI revenue?
This is the distinction that decides whether the metric helps you or misleads you, and most stacks collapse all three into one word.
| AI visibility | AI traffic | AI revenue | |
|---|---|---|---|
| What it measures | Were you surfaced in the answer | Did a human click through to you | Did that human pay you |
| Unit | Rate across sampled answers | Sessions | Settled charges, net of refunds |
| Produced by | A prompt tracker running your prompt set | Server-side referrer capture and first-party session logging | A session identity carried through to the payment record [9] |
| Native failure mode | Prompt set is unrepresentative | Referrer stripped; visit files as Direct [6] | Session identity lost before checkout |
| Can Search Console or GA4 see it | No — Search Console folds AI Overviews and AI Mode into the overall Web search type [3] | Partly — GA4's AI Assistants channel names ChatGPT, Gemini, DeepSeek, Copilot and Grok, and excludes AI Overviews and AI Mode [4] | No — GA4's conversion is an event, not a payment |
| What it cannot tell you | Whether anyone clicked | Whether anyone bought | Which prompt started it, without the visibility layer |
Read that bottom row in both directions. Visibility without revenue tells you that you were mentioned and nothing about whether it mattered. Revenue without visibility tells you a channel produced money and nothing about which questions produced the channel. You need both halves joined, or you are steering with one eye closed.
The size of the gap between the layers is not theoretical. Otterly published their own numbers on this: GA4 last-touch credited Google Search with 35% of their signups, ChatGPT with 7%, and Claude with 0.1% — while their post-signup survey, asking new users how they first heard about the product, returned ChatGPT at 11% and Claude at 10.6% [7]. Same company, same period, two orders of magnitude apart on one engine — the monitoring-versus-attribution split that the Attrifast vs Otterly comparison walks through line by line. In our own 200-site payment-verified benchmark, a median 34% of what GA4 files as "Direct" turns out to be AI-referred, and SMBs undercount AI traffic by a median 64% [10].
And the leakage runs both ways. A large share of AI answers are consumed without any click at all — the answer was the destination. So a visibility score that goes up while sessions stay flat is not necessarily a broken measurement. It might be a correctly measured brand impression that your click-counting analytics is structurally unable to see.
Why does measuring visibility alone push teams toward the wrong prompts?
Because visibility is optimisable independently of revenue, and the gradient points the wrong way.
Informational prompts are structurally easier to win. They have consensus answers, they reward clear reference content, and the competitive field is thinner because fewer commercial players bother. Commercial prompts — the ones with a buyer, a budget and a shortlist behind them — are harder on every axis. So a team graded on a single blended visibility number will, entirely rationally, publish more definitional content, watch the score climb, and report a good quarter.
The composition of AI answers themselves is shifting under that assumption, which makes the drift more expensive over time rather than less. Semrush's study across more than 10 million keywords found AI Overviews settling at around 16% of queries by November 2025, but the intent mix moving sharply: commercial-intent keywords triggering an AI Overview rose from 8.15% to 18.57%, transactional from 1.98% to 13.94%, and navigational from 0.84% to 10.33% [5]. The lower-funnel surface is expanding. A prompt set that was mostly informational when you built it is drifting further from where the money is every quarter you leave it alone.
Then there is the per-engine problem hiding inside a blended score. Visitors from different engines are not worth the same. In the 200-site benchmark, revenue per visitor runs $1.94 on Claude and $1.42 on Perplexity against $0.87 on ChatGPT for B2B SaaS, and AI-referred traffic converts at 2.7% against 1.4% for Google organic [10]. Otterly saw the same shape from a completely independent dataset — ChatGPT visitors converting at 25% versus 15% for organic search, a 66% higher rate [7]. A single blended visibility number treats a Claude citation and a ChatGPT citation as interchangeable when the visitors behind them differ by more than 2x in value.
What fixes it is not a better score. It is a weighting. Every prompt in your set gets an estimated value derived from what visitors arriving on that prompt actually paid, and the program is graded on weighted visibility rather than raw visibility. That requires three joins that most stacks never make: prompt → engine, engine → session, session → payment. Stripe hands you the last one for free if you use it — client_reference_id and metadata exist on the Checkout Session object precisely so an external system can carry its own identifier through the payment [9]. It is the most underused field in attribution.
The full walkthrough of that pipeline, engine by engine, lives on how AI visibility connects to revenue attribution. If your immediate question is narrower — just ChatGPT, just revenue — ChatGPT revenue attribution is the specific version.
Where does AI visibility break as a metric?
Five honest limits. I would rather you meet them here than in a board meeting.
Sampling variance is real and it is not noise you can wish away. The same prompt on the same engine on the same day can return different sources. Small prompt sets sampled infrequently produce charts that look like signal and are mostly variance. Below roughly 30 prompts, treat week-to-week moves under 5 percentage points as unreadable.
Brand mention and citation are not the same event. Being named in the prose without a link is real visibility with zero click potential. Being cited as a source without being named is a click opportunity with weak brand transfer. Tools differ in which one they count, and a score that silently blends them is not comparable to a score that does not.
Engines disagree, and the disagreement is the useful part. A blended number across four engines is the average of four different retrieval systems with different index freshness and different source preferences. The GEO researchers found optimisation efficacy varying by domain [1]; the same is true across engines. If your tool only shows you one number, you have lost the actionable layer.
Query fan-out means you are not being scored on the prompt you wrote. Google's documentation describes AI Mode and AI Overviews issuing multiple related searches across subtopics to build a response [2]. Your prompt is an input to a process that generates its own sub-queries. You are measuring visibility against a question set you only partly control.
Visibility is not incrementality. Even a perfectly weighted, revenue-joined visibility program tells you which prompts touched revenue, not which prompts caused it. Branded prompts are the canonical trap — they will look excellent forever and may be capturing demand you already created elsewhere. Holdout tests answer that. No visibility metric ever will.
If you are at the stage of choosing something to run this with, the buyer's guide to AI visibility tools covers what the platforms in this category actually do and what they cost. The short version of the market: most of them measure the top layer well and stop there, which is precisely the gap this article is about. If you would rather compare on the attribution axis instead, attribution software by what it joins to goes tool by tool, and Stripe-native revenue attribution covers the payment side of the join.
FAQ: AI visibility
What is AI visibility, in one sentence?
AI visibility is the measured rate at which an AI answer engine surfaces your brand or domain in its generated answers across a defined set of prompts, sampled repeatedly over time. It is a rate rather than a rank, it is per-engine rather than universal, and it is only interpretable next to the prompt set that produced it.
How do you measure AI visibility?
Build a prompt set of buyer-stage questions, run it across each engine on a repeating schedule with multiple samples per prompt, parse each answer for your domain and your competitors' domains, and express the result as the share of sampled answers in which you appeared. The prompt set is where the quality of the measurement is decided; the rest is scheduling and parsing.
What is a good AI visibility score?
There is no portable number. A 40 on branded and definitional prompts is unremarkable; a 12 on head-on commercial comparison prompts in a competitive category can be a strong result. Benchmark internally against your own trend on a fixed prompt set, and relatively against named competitors on identical prompts in identical runs. Treat any cross-brand score quoted without a published prompt set as marketing rather than measurement.
Can I measure AI visibility in Google Analytics or Search Console?
No. Both are click counters positioned downstream of the answer. Search Console reports AI Overviews and AI Mode inside the overall Web search type, with an AI Overview occupying a single position and all its links assigned that position [3]. GA4's AI Assistants channel covers arrivals from sources like ChatGPT, Gemini, DeepSeek, Copilot and Grok and explicitly excludes AI Overviews and AI Mode, which are filed under Organic Search [4]. Neither observes whether you were mentioned, which is the thing visibility measures.
What is the difference between AI visibility and share of voice?
AI visibility is your absolute presence: the share of sampled answers that included you. Share of voice is your relative presence: your citations as a proportion of all citations across every brand on the same prompt set. They move independently — a new competitor being cited heavily can cut your share of voice while your visibility rate holds perfectly flat.
Why does AI visibility need to be tied to revenue?
Because the cheapest visibility to win is usually the least valuable, and a team graded on an unweighted score will drift toward it without anyone making a bad decision. Weighting each prompt by what visitors arriving on it actually paid is what keeps the metric pointed at the business. That requires joining the citation to a session and the session to a settled payment — a join GA4 structurally cannot make, because most AI-referred sessions reach it with the referrer already gone [6].
The bottom line
AI visibility is a real, measurable quantity: the rate at which answer engines surface you across a prompt set you defined, sampled over time, per engine. It is worth measuring. It is not worth measuring alone.
The three sentences I would want a team to leave with. First, the prompt set is the metric — a score without a published denominator is not comparable to anything, including your own score last quarter if you changed the list. Second, visibility, traffic, and revenue are three separate layers with three separate failure modes, and no tool that only sees one of them can tell you whether the program is working. Third, an unweighted visibility score has a built-in bias toward the prompts that send the fewest buyers, and the only durable correction is to price each prompt by what it actually produced.
That last step is the one nobody's analytics stack does by default. If you want to see your own version — which prompts, which engines, and what each one settled in Stripe — it takes one script tag and one restricted Stripe key: see how the AI visibility to revenue join works, or compare Starter at $9.99/mo and Pro at $49/mo. Seven-day free trial, $0 due today, no free tier, and a launch promo running at 50% off.
References
- GEO: Generative Engine Optimization — formalising visibility metrics for generative engines, up to 40% visibility gain, efficacy varying by domain — arXiv, Aggarwal et al., Princeton / Georgia Tech / Allen Institute (2024)
- AI features and your website — query fan-out, and why AI Mode and AI Overviews return varying link sets — Google Search Central (2026)
- Search Console data methodology — how AI Overviews and AI Mode clicks, impressions and position are counted — Google Search Console Help (2026)
- Default channel group — the AI Assistants channel definition and its exclusions — Google Analytics Help (2026)
- Semrush AI Overviews Study — 10M+ keywords, trigger rate and intent mix over 2025 — Semrush (December 2025)
- Why ChatGPT traffic shows as Direct in GA4 — referrer-stripping mechanics, April 2026 measurement — Clickport (2026)
- Claude drives 10.6% of our signups; Google Analytics says 0.1% — Otterly.ai (July 2026)
- AI Search Stats 2026 — generative AI platform market share and referral behaviour — Similarweb (July 2026)
- Checkout Session object — client_reference_id and metadata as attribution join keys — Stripe (2026)
- AI traffic revenue benchmark 2026 — 200 Stripe-connected sites, per-engine RPV and conversion — Attrifast (2026)